Page 1 of 1
1 1 points Book Print References Mc Key comparative figures for both Apple and Google follow. Apple $ millions. Current
Posted: Mon May 30, 2022 7:22 am
by answerhappygod
- 1 1 Points Book Print References Mc Key Comparative Figures For Both Apple And Google Follow Apple Millions Current 1 (36.63 KiB) Viewed 28 times
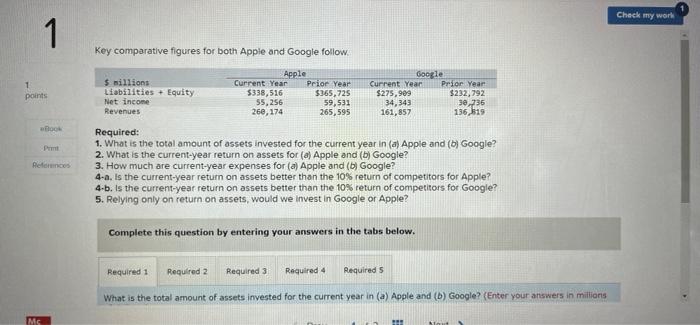
1 1 points Book Print References Mc Key comparative figures for both Apple and Google follow. Apple $ millions. Current Year Liabilities Equity Current Year Prior Year $338,516 Prior Year $232,792 $365,725 $275,909 55,256 59,531 Net income Revenues 34,343 30,736 260,174 265,595 161,857 136,819 Required: 1. What is the total amount of assets invested for the current year in (a) Apple and (b) Google? 2. What is the current-year return on assets for (a) Apple and (b) Google? 3. How much are current-year expenses for (a) Apple and (b) Google? 4-a. Is the current-year return on assets better than the 10% return of competitors for Apple? 4-b. Is the current-year return on assets better than the 10% return of competitors for Google? 5. Relying only on return on assets, would we invest in Google or Apple? Complete this question by entering your answers in the tabs below. Required 1 Required 2 Required 3 Required 4 Required S What is the total amount of assets invested for the current year in (a) Apple and (b) Google? (Enter your answers in millions 2 Google Check my work