Page 1 of 1
The following graph shows the demand curve for sedans (for example, Toyota Camrys or Honda Accords) in New York City. Fo
Posted: Sun May 29, 2022 7:41 pm
by answerhappygod
- The Following Graph Shows The Demand Curve For Sedans For Example Toyota Camrys Or Honda Accords In New York City Fo 1 (53.57 KiB) Viewed 43 times
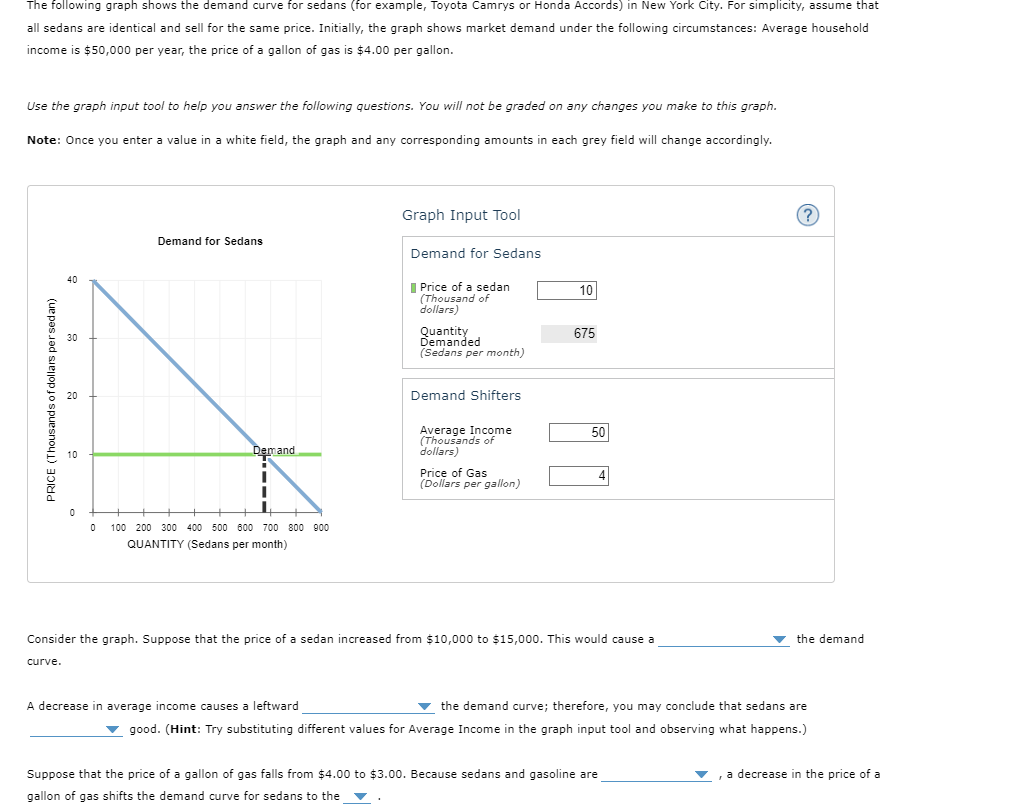
The following graph shows the demand curve for sedans (for example, Toyota Camrys or Honda Accords) in New York City. For simplicity, assume that all sedans are identical and sell for the same price. Initially, the graph shows market demand under the following circumstances: Average household income is $50,000 per year, the price of a gallon of gas is $4.00 per gallon. Use the graph input tool to help you answer the following questions. You will not be graded on any changes you make to this graph. Note: Once you enter a value in a white field, the graph and any corresponding amounts in each grey field will change accordingly. Graph Input Tool ? Demand for Sedans Demand for Sedans Price of a sedan (Thousand of dollars) Quantity Demanded (Sedans per month) Demand Shifters 50 Average Income (Thousands of dollars) Demand Price of Gas (Dollars per gallon) 0 100 200 300 400 500 600 700 800 900 QUANTITY (Sedans per month) Consider the graph. Suppose that the price of a sedan increased from $10,000 to $15,000. This would cause a the demand curve. A decrease in average income causes a leftward Suppose that the price of a gallon of gas falls from $4.00 to $3.00. Because sedans and gasoline are gallon of gas shifts the demand curve for sedans to the PRICE (Thousands of dollars per sedan) 8 10 675 the demand curve; therefore, you may conclude that sedans are ▼ good. (Hint: Try substituting different values for Average Income in the graph input tool and observing what happens.) ▼, a decrease in the price of a