Page 1 of 1
The table below contains data on Fincorp Inc. The balance sheet items correspond to values at year-end 2018 and 2019, wh
Posted: Sun May 29, 2022 5:04 pm
by answerhappygod
- The Table Below Contains Data On Fincorp Inc The Balance Sheet Items Correspond To Values At Year End 2018 And 2019 Wh 1 (25.04 KiB) Viewed 22 times
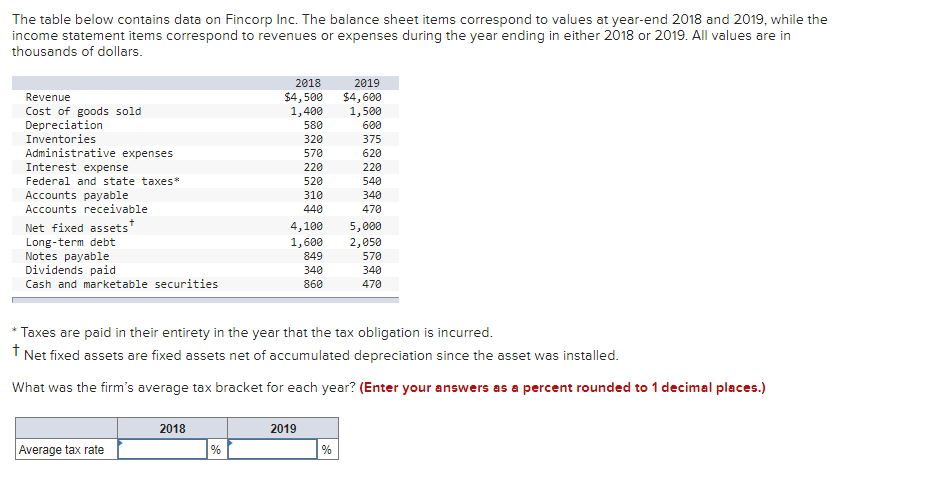
The table below contains data on Fincorp Inc. The balance sheet items correspond to values at year-end 2018 and 2019, while the income statement items correspond to revenues or expenses during the year ending in either 2018 or 2019. All values are in thousands of dollars. 2018 2019 Revenue $4,500 $4,600 Cost of goods sold 1,400 1,500 Depreciation 580 600 Inventories 320 375 Administrative expenses 570 620 Interest expense 220 220 Federal and state taxes* 520 540 Accounts payable 310 340 Accounts receivable 440 470 4,100 5,000 Net fixed assets Long-term debt 1,600 2,050 Notes payable 849 570 Dividends paid 340 340 Cash and marketable securities 860 470 * Taxes are paid in their entirety in the year that the tax obligation is incurred. *Net fixed assets are fixed assets net of accumulated depreciation since the asset was installed. What was the firm's average tax bracket for each year? (Enter your answers as a percent rounded to 1 decimal places.) 2018 2019 Average tax rate % %