Page 1 of 1
Assessment objectives: Use of analysis and Matlab to plot the convolution of individualized discrete time signals. Consi
Posted: Thu May 26, 2022 10:53 am
by answerhappygod
- Assessment Objectives Use Of Analysis And Matlab To Plot The Convolution Of Individualized Discrete Time Signals Consi 1 (58.4 KiB) Viewed 26 times
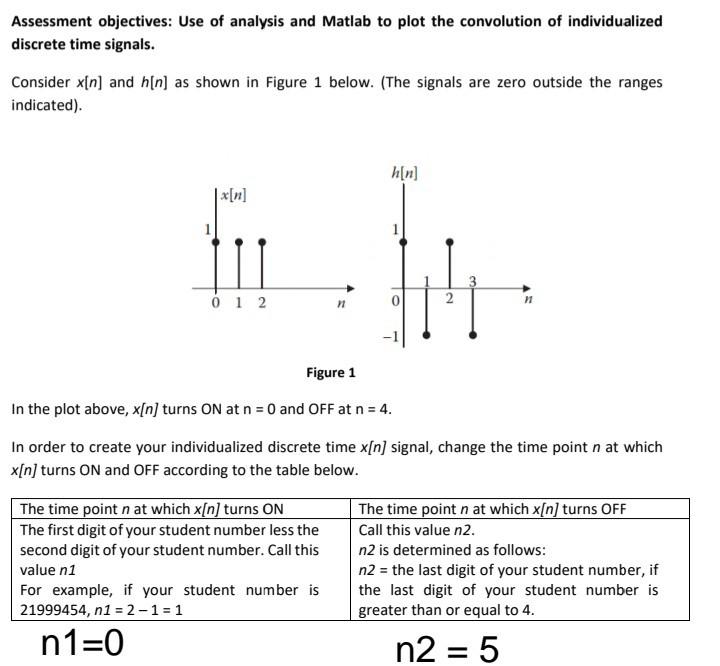
Assessment objectives: Use of analysis and Matlab to plot the convolution of individualized discrete time signals. Consider x[n] and h[n] as shown in Figure 1 below. (The signals are zero outside the ranges indicated). h[n] 012 2 n Figure 1 In the plot above, x[n] turns ON at n = 0 and OFF at n = 4. In order to create your individualized discrete time x[n] signal, change the time point n at which x[n] turns ON and OFF according to the table below. The time point n at which x[n] turns OFF Call this value n2. The time point n at which x[n] turns ON The first digit of your student number less the second digit of your student number. Call this value n1 n2 is determined as follows: For example, if your student number is 21999454, n1 =2-1=1 n2 = the last digit of your student number, if the last digit of your student number is greater than or equal to 4. n1=0 n2 = 5