Page 1 of 1
Figure 1.1 Impacts of the COVID-19 crisis on households, by country income group Experienced reduced total income Receiv
Posted: Thu May 26, 2022 7:48 am
by answerhappygod
- Figure 1 1 Impacts Of The Covid 19 Crisis On Households By Country Income Group Experienced Reduced Total Income Receiv 1 (144.26 KiB) Viewed 31 times
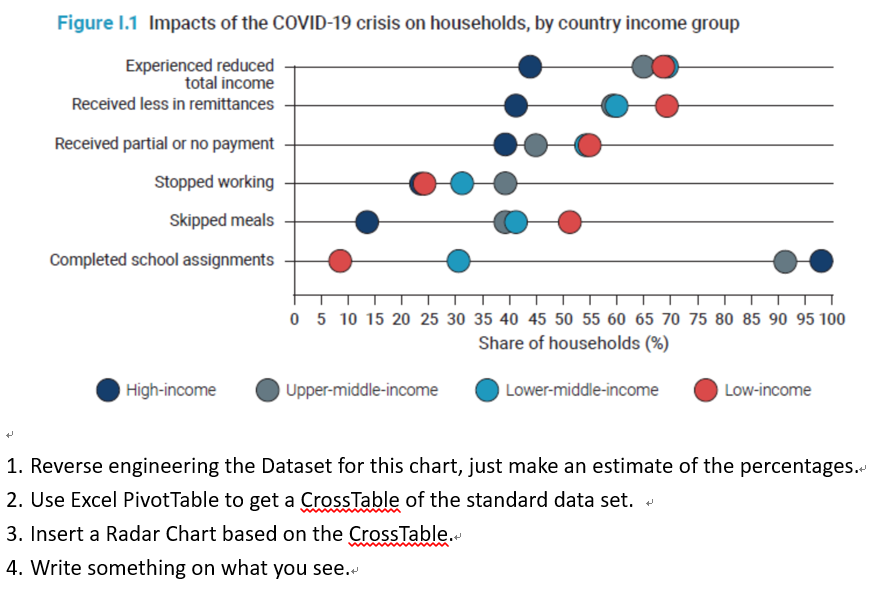
Figure 1.1 Impacts of the COVID-19 crisis on households, by country income group Experienced reduced total income Received less in remittances Received partial or no payment Stopped working Skipped meals Completed school assignments 0 5 10 15 20 25 30 35 40 45 50 55 60 65 70 75 80 85 90 95 100 Share of households (%) High-income Upper-middle-income Lower-middle-income Low-income 1. Reverse engineering the Dataset for this chart, just make an estimate of the percentages. 2. Use Excel Pivot Table to get a CrossTable of the standard data set. → 3. Insert a Radar Chart based on the CrossTable. 4. Write something on what you see.