Page 1 of 1
2. The probability distributions of returns for Stock A and Stock B are given below: State of Economy Probability Bull S
Posted: Thu May 26, 2022 7:02 am
by answerhappygod
- 2 The Probability Distributions Of Returns For Stock A And Stock B Are Given Below State Of Economy Probability Bull S 1 (153.89 KiB) Viewed 31 times
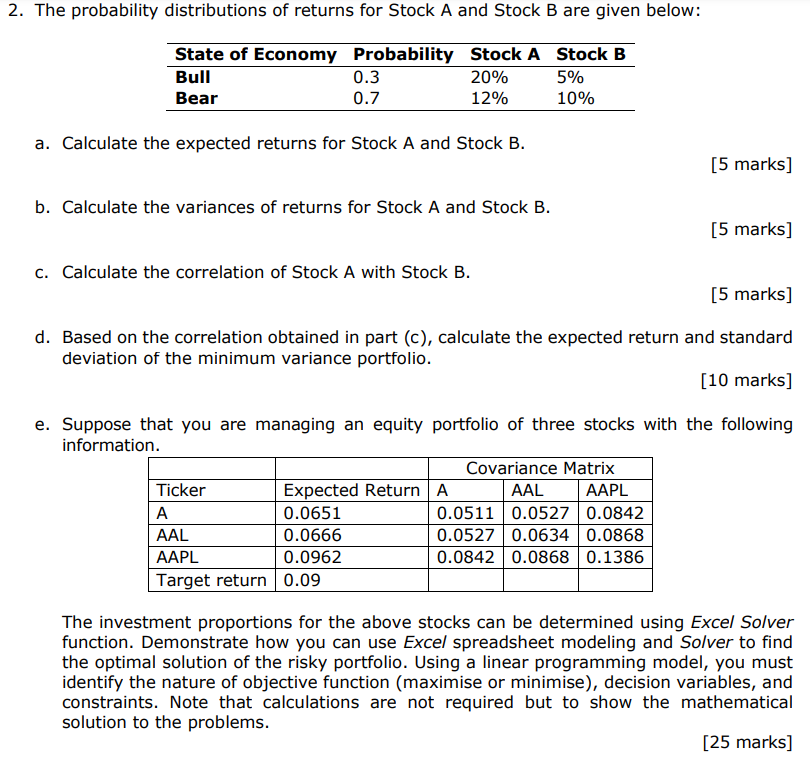
2. The probability distributions of returns for Stock A and Stock B are given below: State of Economy Probability Bull Stock A Stock B 20% 5% 0.3 0.7 Bear 12% 10% a. Calculate the expected returns for Stock A and Stock B. [5 marks] b. Calculate the variances of returns for Stock A and Stock B. [5 marks] c. Calculate the correlation of Stock A with Stock B. [5 marks] d. Based on the correlation obtained in part (c), calculate the expected return and standard deviation of the minimum variance portfolio. [10 marks] e. Suppose that you are managing an equity portfolio of three stocks with the following information. Ticker Expected Return A 0.0651 A Covariance Matrix AAL AAPL 0.0511 0.0527 0.0842 0.0527 0.0634 0.0868 0.0842 0.0868 0.1386 AAL 0.0666 AAPL 0.0962 Target return 0.09 The investment proportions for the above stocks can be determined using Excel Solver function. Demonstrate how you can use Excel spreadsheet modeling and Solver to find the optimal solution of the risky portfolio. Using a linear programming model, you must identify the nature of objective function (maximise or minimise), decision variables, and constraints. Note that calculations are not required but to show the mathematical solution to the problems. [25 marks]