- I Write Code To Visualize Survey Results Preliminaries For This Lab Create Another Folder Called Lab15 Navigate To 1 (105.36 KiB) Viewed 107 times
- I Write Code To Visualize Survey Results Preliminaries For This Lab Create Another Folder Called Lab15 Navigate To 2 (64.46 KiB) Viewed 107 times
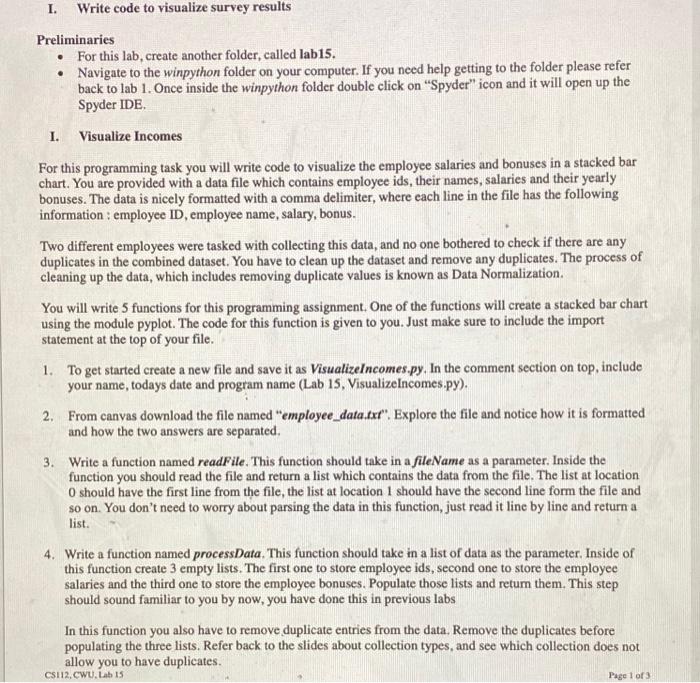
I. Write code to visualize survey results Preliminaries For this lab, create another folder, called lab15. • Navigate to the winpython folder on your computer. If you need help getting to the folder please refer back to lab 1. Once inside the winpython folder double click on "Spyder" icon and it will open up the Spyder IDE. 1. Visualize Incomes For this programming task you will write code to visualize the employee salaries and bonuses in a stacked bar chart. You are provided with a data file which contains employee ids, their names, salaries and their yearly bonuses. The data is nicely formatted with a comma delimiter, where each line in the file has the following information : employee ID, employee name, salary, bonus. Two different employees were tasked with collecting this data, and no one bothered to check if there are any duplicates in the combined dataset. You have to clean up the dataset and remove any duplicates. The process of cleaning up the data, which includes removing duplicate values is known as Data Normalization. You will write 5 functions for this programming assignment. One of the functions will create a stacked bar chart using the module pyplot. The code for this function is given to you. Just make sure to include the import statement at the top of your file. 1. To get started create a new file and save it as VisualizeIncomes.py. In the comment section on top, include your name, todays date and program name (Lab 15, Visualizelncomes.py). 2. From canvas download the file named "employee_data.txt". Explore the file and notice how it is formatted and how the two answers are separated. 3. Write a function named readFile. This function should take in a fileName as a parameter. Inside the function you should read the file and return a list which contains the data from the file. The list at location O should have the first line from the file, the list at location 1 should have the second line form the file and so on. You don't need to worry about parsing the data in this function, just read it line by line and return a list. 4. Write a function named processData. This function should take in a list of data as the parameter. Inside of this function create 3 empty lists. The first one to store employee ids, second one to store the employee salaries and the third one to store the employee bonuses. Populate those lists and return them. This step should sound familiar to you by now, you have done this in previous labs In this function you also have to remove duplicate entries from the data. Remove the duplicates before populating the three lists. Refer back to the slides about collection types, and see which collection does not allow you to have duplicates. CS112, CWU, Lab 15 Page 1 of 3
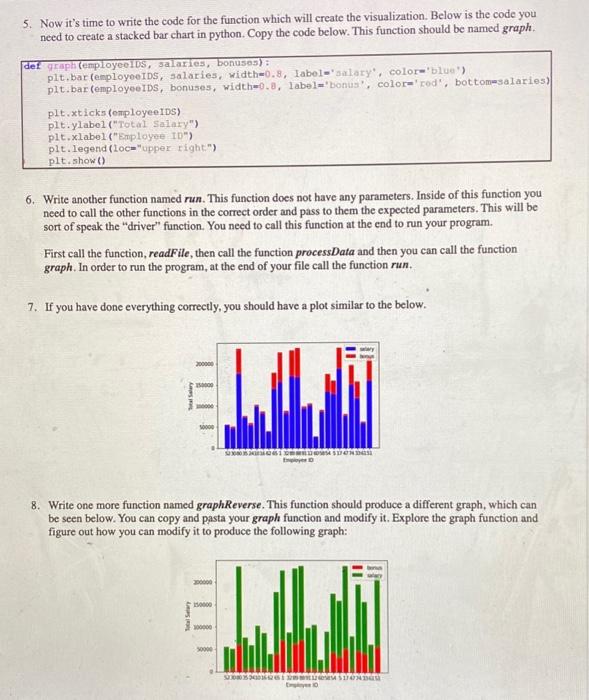
5. Now it's time to write the code for the function which will create the visualization. Below is the code you need to create a stacked bar chart in python. Copy the code below. This function should be named graph. det gesph (employees, salaries, bonuses); plt.bar(employeeIDS, salaries, width-0.8, label='salary, color='blue) plt.bar (employeeIDS, bonuses, width-0.0, label='bonus, color-'red', bottom salaries) plt.xticks (employee IDS) plt.ylabel("Total Salary") plt.xlabel("Employee ID") plt.legend (Loc="upper right) plt.show) 6. Write another function named run. This function does not have any parameters. Inside of this function you need to call the other functions in the correct order and pass to them the expected parameters. This will be sort of speak the "driver" function. You need to call this function at the end to run your program. First call the function, readFile, then call the function processData and then you can call the function graph. In order to run the program, at the end of your file call the function run. 7. If you have done everything correctly, you should have a plot similar to the below. 200000 000 SON 8. Write one more function named graphReverse. This function should produce a different graph, which can be seen below. You can copy and pasta your graph function and modify it. Explore the graph function and figure out how you can modify it to produce the following graph: 00000 150000 00000 SI