Page 1 of 1
45 Pressure - kPa 40 35 30 Bubble curve 0.2 0.4 0.6 0 0.8 1.2 Molar concentration of N₂ A mixture diagram of Oxygen (O₂)
Posted: Tue May 24, 2022 9:39 am
by answerhappygod
- 45 Pressure Kpa 40 35 30 Bubble Curve 0 2 0 4 0 6 0 0 8 1 2 Molar Concentration Of N A Mixture Diagram Of Oxygen O 1 (626.69 KiB) Viewed 29 times
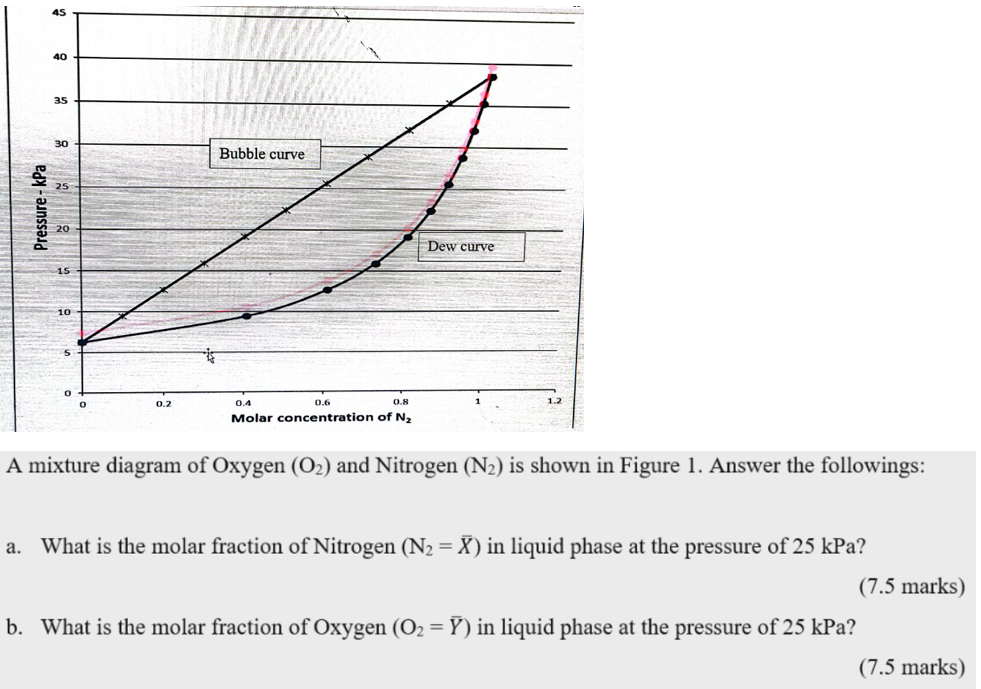
45 Pressure - kPa 40 35 30 Bubble curve 0.2 0.4 0.6 0 0.8 1.2 Molar concentration of N₂ A mixture diagram of Oxygen (O₂) and Nitrogen (N₂) is shown in Figure 1. Answer the followings: a. What is the molar fraction of Nitrogen (N₂ = X) in liquid phase at the pressure of 25 kPa? (7.5 marks) b. What is the molar fraction of Oxygen (O₂ = Ỹ) in liquid phase at the pressure of 25 kPa? (7.5 marks) 25 20 15 10 5 0 Dew curve