Page 1 of 1
Question 1 A thermocouple used between 0 and 500 °C has the experimental input-output characteristics as shown in Table
Posted: Tue May 24, 2022 8:55 am
by answerhappygod
- Question 1 A Thermocouple Used Between 0 And 500 C Has The Experimental Input Output Characteristics As Shown In Table 1 (153 KiB) Viewed 34 times
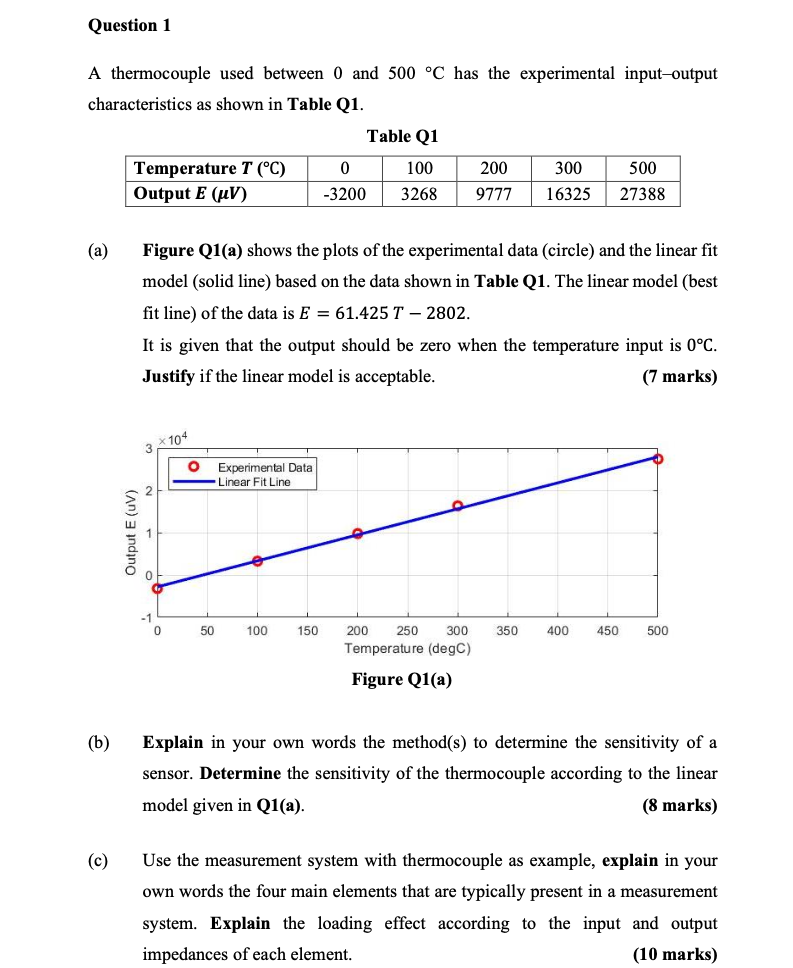
Question 1 A thermocouple used between 0 and 500 °C has the experimental input-output characteristics as shown in Table Q1. Table Q1 0 300 500 Temperature T (°C) Output E (UV) 100 200 -3200 3268 9777 16325 27388 (a) Figure Q1(a) shows the plots of the experimental data (circle) and the linear fit model (solid line) based on the data shown Table Q1. The linear model (best fit line) of the data is E = 61.425 T - 2802. It is given that the output should be zero when the temperature input is 0°C. Justify if the linear model is acceptable. (7 marks) 104 3 O Experimental Data Linear Fit Line 0 50 100 150 350 400 450 500 200 250 300 Temperature (degC) Figure Q1(a) (b) Explain in your own words the method(s) to determine the sensitivity of a sensor. Determine the sensitivity of the thermocouple according to the linear model given in Q1(a). (8 marks) (c) Use the measurement system with thermocouple as example, explain in your own words the four main elements that are typically present in a measurement system. Explain the loading effect according to the input and output impedances of each element. (10 marks) Output E (UV)