Page 1 of 1
Please take the screenshots of the codes and output that appear in the console and paste them on a word file. Upload bot
Posted: Tue May 24, 2022 7:50 am
by answerhappygod
- Please Take The Screenshots Of The Codes And Output That Appear In The Console And Paste Them On A Word File Upload Bot 1 (70.69 KiB) Viewed 29 times
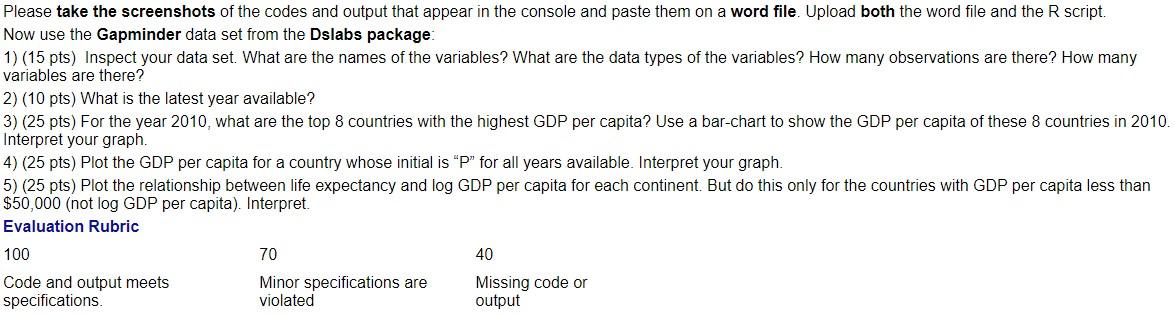
Please take the screenshots of the codes and output that appear in the console and paste them on a word file. Upload both the word file and the R script. Now use the Gapminder data set from the Dslabs package: 1) (15 pts) Inspect your data set. What are the names of the variables? What are the data types of the variables? How many observations are there? How many variables are there? 2) (10 pts) What is the latest year available? 3) (25 pts) For the year 2010, what are the top 8 countries with the highest GDP per capita? Use a bar-chart to show the GDP per capita of these 8 countries in 2010. Interpret your graph. 4) (25 pts) Plot the GDP per capita for a country whose initial is "P" for all years available. Interpret your graph. 5) (25 pts) Plot the relationship between life expectancy and log GDP per capita for each continent. But do this only for the countries with GDP per capita less than $50,000 (not log GDP per capita). Interpret. Evaluation Rubric 100 70 40 Code and output meets specifications. Minor specifications are violated Missing code or output