- 9 For The Bar Function From The Matplotlib Pyplot Module The Help Function Gives The Following Information B 1 (87.28 KiB) Viewed 116 times
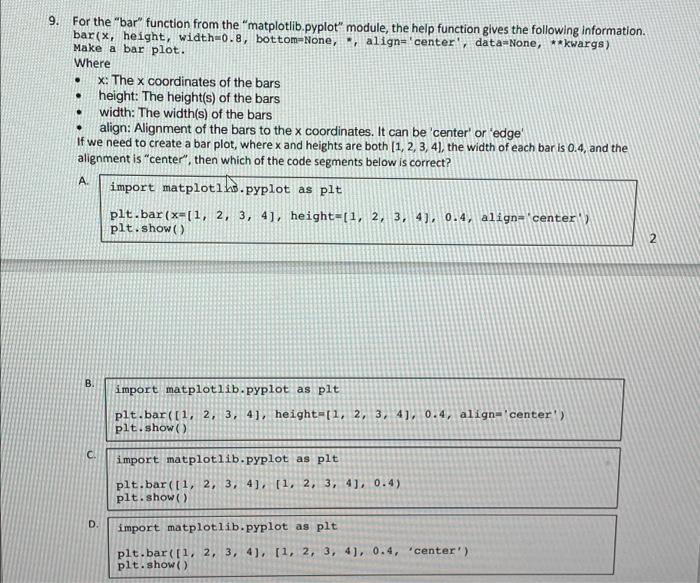
9. . . . For the "bar" function from the "matplotlib.pyplot" module, the help function gives the following Information bar(x, height, width-0.8, bottom=None, " align='center', data=None, **kwargs) Make a bar plot. Where x: The x coordinates of the bars height: The height(s) of the bars width: The width(s) of the bars align: Alignment of the bars to the x coordinates. It can be 'center' or 'edge If we need to create a bar plot, where x and heights are both (1, 2, 3, 4), the width of each bar is 0.4, and the alignment is "center", then which of the code segments below is correct? A. import matplotih.pyplot as pit plt.bar(x-(1, 2, 3, 41, height=[1, 2, 3, 4), 0.4, align="center plt.show() . В. import matplotlib.pyplot as plt plt.bar([1, 2, 3, 4], height=[1, 2, 3, 4], 0.4, align='center) plt.show() C. import matplotlib.pyplot as plt plt.bar([1, 2, 3, 4), (1, 2, 3, 4], 0.4) plt.show() D import matplotlib.pyplot as plt plt.bar([1, 2, 3, 4), (1, 2, 3, 4), 0.4, 'center') plt.show()