Page 1 of 1
Note 2: All graphs should have correct labels to X-and Y-axis, title to graph and tick lines. Table 1. Analytical respon
Posted: Fri Nov 26, 2021 8:34 am
by answerhappygod
- Note 2 All Graphs Should Have Correct Labels To X And Y Axis Title To Graph And Tick Lines Table 1 Analytical Respon 1 (70.4 KiB) Viewed 65 times
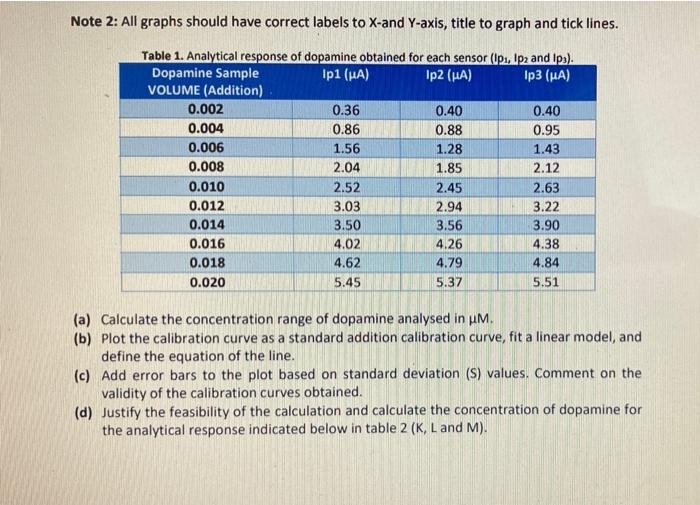
Note 2: All graphs should have correct labels to X-and Y-axis, title to graph and tick lines. Table 1. Analytical response of dopamine obtained for each sensor (Ipa, lpa and Ip). Dopamine Sample Ip1 (MA) 1p2 (NA) 1p3 (MA) VOLUME (Addition) 0.002 0.36 0.40 0.40 0.004 0.86 0.88 0.95 0.006 1.56 1.28 1.43 0.008 2.04 1.85 2.12 0.010 2.52 2.45 2.63 0.012 3.03 2.94 3.22 0.014 3.50 3.56 3.90 0.016 4.02 4.26 4.38 0.018 4.62 4.79 4.84 0.020 5.45 5.37 5.51 (a) Calculate the concentration range of dopamine analysed in M. (b) Plot the calibration curve as a standard addition calibration curve, fit a linear model, and define the equation of the line. (c) Add error bars to the plot based on standard deviation (S) values. Comment on the validity of the calibration curves obtained. (d) Justify the feasibility of the calculation and calculate the concentration of dopamine for the analytical response indicated below in table 2 (K, L and M).