Page 1 of 1
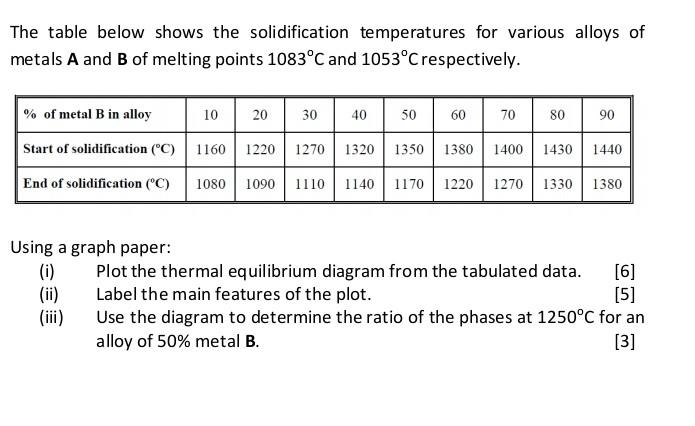
The table below shows the solidification temperatures for various alloys of metals A and B of melting points 1083°C and
Posted: Sun May 22, 2022 10:35 pm
by answerhappygod
- The Table Below Shows The Solidification Temperatures For Various Alloys Of Metals A And B Of Melting Points 1083 C And 1 (46.76 KiB) Viewed 27 times
The table below shows the solidification temperatures for various alloys of metals A and B of melting points 1083°C and 1053°C respectively. % of metal B in alloy 10 20 Start of solidification (°C) 1160 1220 1270 1320 End of solidification (°C) 1080 1090 30 40 50 60 70 80 90 1270 1320 1350 1380 1400 1430 1440 1110 1140 1170 1220 1270 1330 1380 Using a graph paper: (i) Plot the thermal equilibrium diagram from the tabulated data. [6] (ii) Label the main features of the plot. [5] (iii) Use the diagram to determine the ratio of the phases at 1250°C for an alloy of 50% metal B. [3]