Page 1 of 1
7. The table below gives VLE experimental data for acetone (1) and water (2) mixtures at 298 K. Notation:x and y denote
Posted: Sun May 22, 2022 3:25 pm
by answerhappygod
- 7 The Table Below Gives Vle Experimental Data For Acetone 1 And Water 2 Mixtures At 298 K Notation X And Y Denote 1 (85.64 KiB) Viewed 18 times
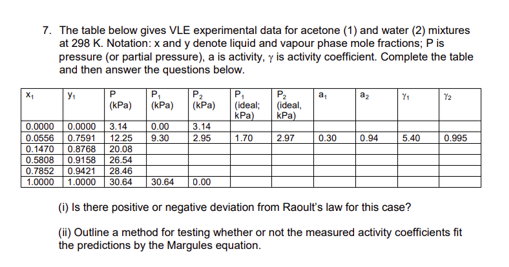
7. The table below gives VLE experimental data for acetone (1) and water (2) mixtures at 298 K. Notation:x and y denote liquid and vapour phase mole fractions; Pis pressure (or partial pressure), a is activity, y is activity coefficient. Complete the table and then answer the questions below. X y. P a. P (kPa) P (kPa) az Y 72 (kPa) P (ideal kPa) P (ideal kPa) 0.00 9.30 3.14 2.95 1.70 2.97 0.30 0.94 5.40 0.995 0.0000 0.0556 0.1470 0.5808 0.7852 1.0000 0.0000 0.7591 0.8768 0.9158 0.9421 1.0000 3.14 12 25 20.08 26.54 28.46 30.64 30.64 0.00 (0) Is there positive or negative deviation from Raoult's law for this case? (ii) Outline a method for testing whether or not the measured activity coefficients fit the predictions by the Margules equation.