Page 1 of 1
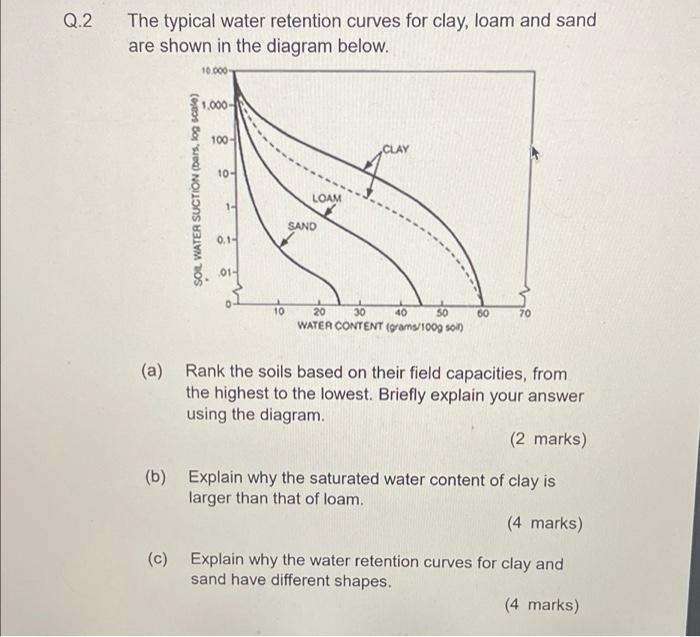
Q.2 The typical water retention curves for clay, loam and sand are shown in the diagram below. 10.000- 1,000- 100- 10- L
Posted: Sun May 22, 2022 3:09 pm
by answerhappygod
- Q 2 The Typical Water Retention Curves For Clay Loam And Sand Are Shown In The Diagram Below 10 000 1 000 100 10 L 1 (51.13 KiB) Viewed 25 times
Q.2 The typical water retention curves for clay, loam and sand are shown in the diagram below. 10.000- 1,000- 100- 10- LOAM 1- SAND 0.1- 01- 10 70 20 30 40 50 60 WATER CONTENT (grams/100g soil) (a) Rank the soils based on their field capacities, from the highest to the lowest. Briefly explain your answer using the diagram. (2 marks) (b) Explain why the saturated water content of clay is larger than that of loam. (4 marks) (c) Explain why the water retention curves for clay and sand have different shapes. (4 marks) SOIL WATER SUCTION (bars, log scale)