Page 1 of 1
The pressure-volume diagram below depicts a thermodynamic cycle for 2 moles of a monoatomic ideal gas. Processes 1->2 an
Posted: Sun May 22, 2022 10:19 am
by answerhappygod
- The Pressure Volume Diagram Below Depicts A Thermodynamic Cycle For 2 Moles Of A Monoatomic Ideal Gas Processes 1 2 An 1 (138.46 KiB) Viewed 24 times
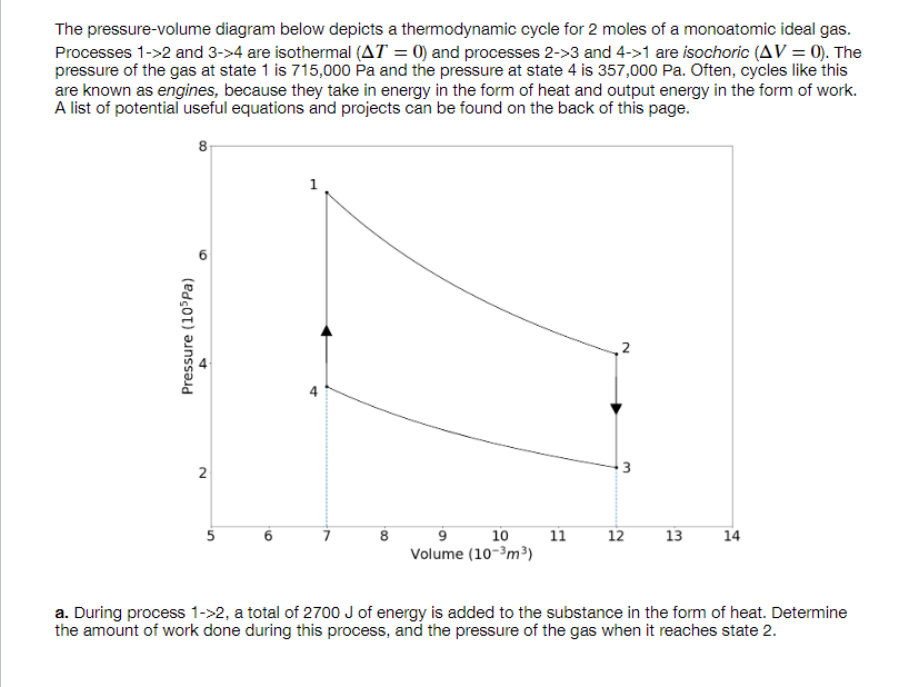
The pressure-volume diagram below depicts a thermodynamic cycle for 2 moles of a monoatomic ideal gas. Processes 1->2 and 3->4 are isothermal (AT = 0) and processes 2->3 and 4->1 are isochoric (AV = 0). The pressure of the gas at state 1 is 715,000 Pa and the pressure at state 4 is 357,000 Pa. Often, cycles like this are known as engines, because they take in energy in the form of heat and output energy in the form of work. A list of potential useful equations and projects can be found on the back of this page. 8 1 Pressure (10 Pa) N 4 2. 3 3 5 8 11 9 10 Volume (10-3m) 12 13 14 a. During process 1->2, a total of 2700 J of energy is added to the substance in the form of heat. Determine the amount of work done during this process, and the pressure of the gas when it reaches state 2.
b. Determine the amount of heat that is removed from the gas during process 2->3. What is the change in the internal energy of the gas during this process? c. The total amount of heat added to the system during one full cycle is 1350 J. Based on this, determine how much work is done on the gas during process 3->4