Page 1 of 1
The following table shows preferred computer operating systems of people in different age groups. Age Group Preferred OS
Posted: Wed Nov 24, 2021 10:05 am
by answerhappygod
- The Following Table Shows Preferred Computer Operating Systems Of People In Different Age Groups Age Group Preferred Os 1 (35.41 KiB) Viewed 106 times
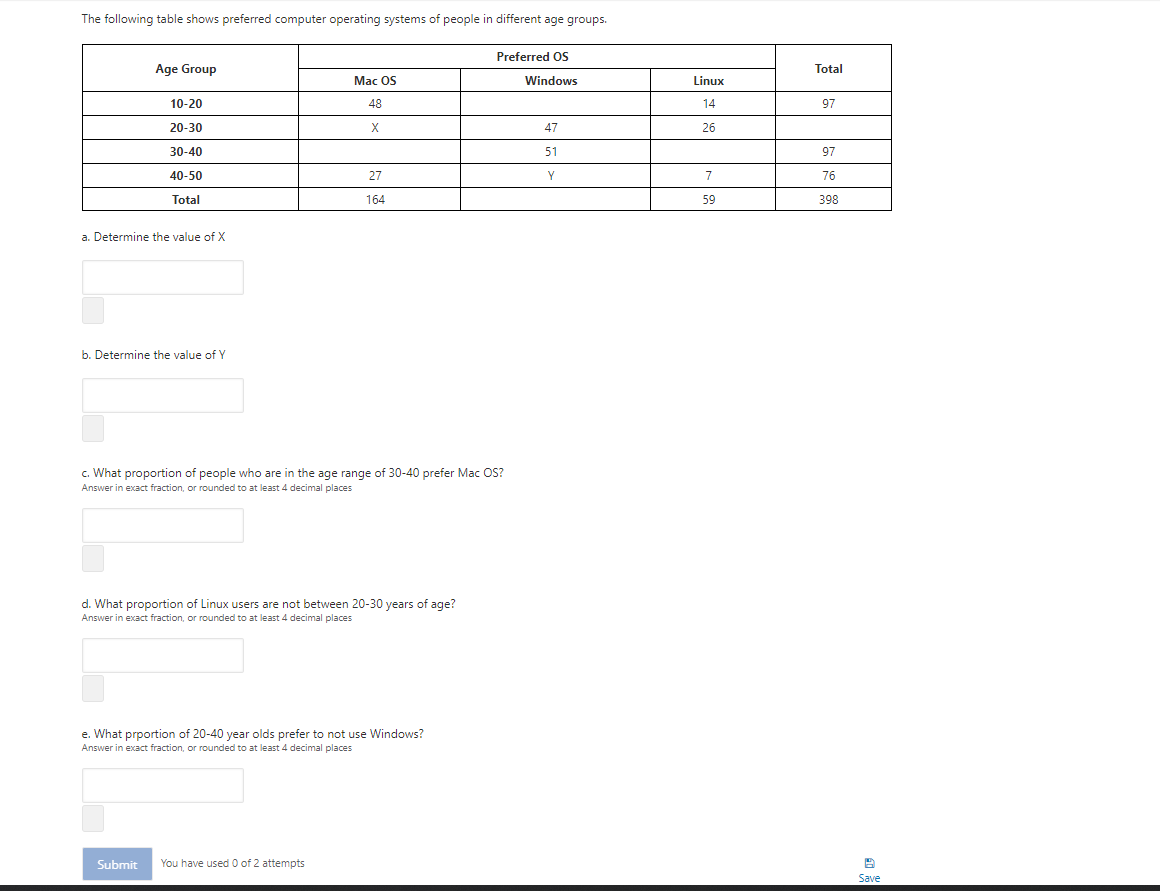
The following table shows preferred computer operating systems of people in different age groups. Age Group Preferred OS Windows Total Mac OS 48 Linux 14 10-20 97 20-30 X 47 26 30-40 51 97 40-50 27 Y 7 76 Total 164 59 398 a. Determine the value of X b. Determine the value of Y c. What proportion of people who are in the age range of 30-40 prefer Mac OS? Answer in exact fraction, or rounded to at least 4 decimal places d. What proportion of Linux users are not between 20-30 years of age? Answer in exact fraction, or rounded to at least 4 decimal places e. What prportion of 20-40 year olds prefer to not use Windows? Answer in exact fraction, or rounded to at least 4 decimal places Submit You have used 0 of 2 attempts Save