Page 1 of 1
(b) The diagram Fig Q1.1 below shows the four processes of a thermodynamic cycle represented on a pressure-volume diagra
Posted: Sat May 21, 2022 4:03 pm
by answerhappygod
- B The Diagram Fig Q1 1 Below Shows The Four Processes Of A Thermodynamic Cycle Represented On A Pressure Volume Diagra 1 (61.57 KiB) Viewed 20 times
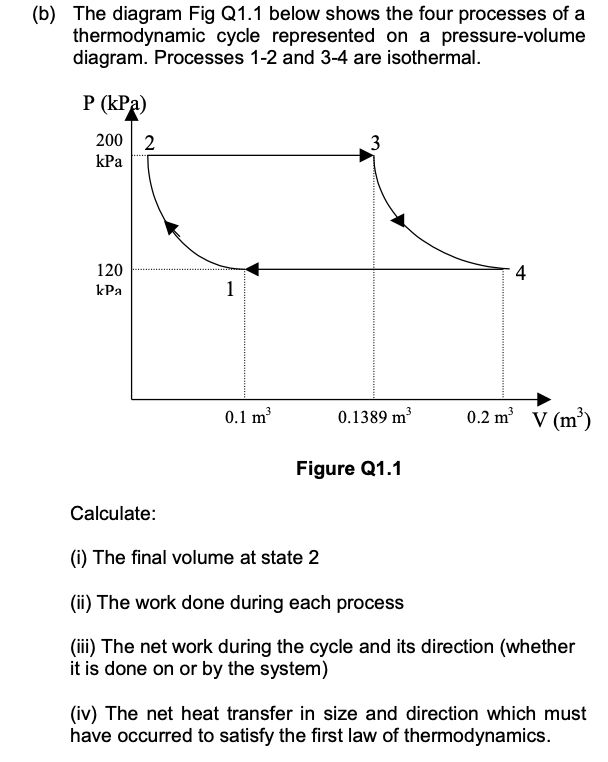
(b) The diagram Fig Q1.1 below shows the four processes of a thermodynamic cycle represented on a pressure-volume diagram. Processes 1-2 and 3-4 are isothermal. P (kPa) 2002 kPa 3 120 kPa 4 1 0.1 m 0.1389 m 0.2 mV (m) Figure Q1.1 Calculate: (i) The final volume at state 2 (ii) The work done during each process (iii) The net work during the cycle and its direction (whether it is done on or by the system) (iv) The net heat transfer in size and direction which must have occurred to satisfy the first law of thermodynamics.