Page 1 of 1
4. Assessment of reactor nonideal behaviour The tracer data shown in Table 4.1 was taken at the exit of a nonideal tubul
Posted: Sat May 21, 2022 3:51 pm
by answerhappygod
- 4 Assessment Of Reactor Nonideal Behaviour The Tracer Data Shown In Table 4 1 Was Taken At The Exit Of A Nonideal Tubul 1 (255.38 KiB) Viewed 31 times
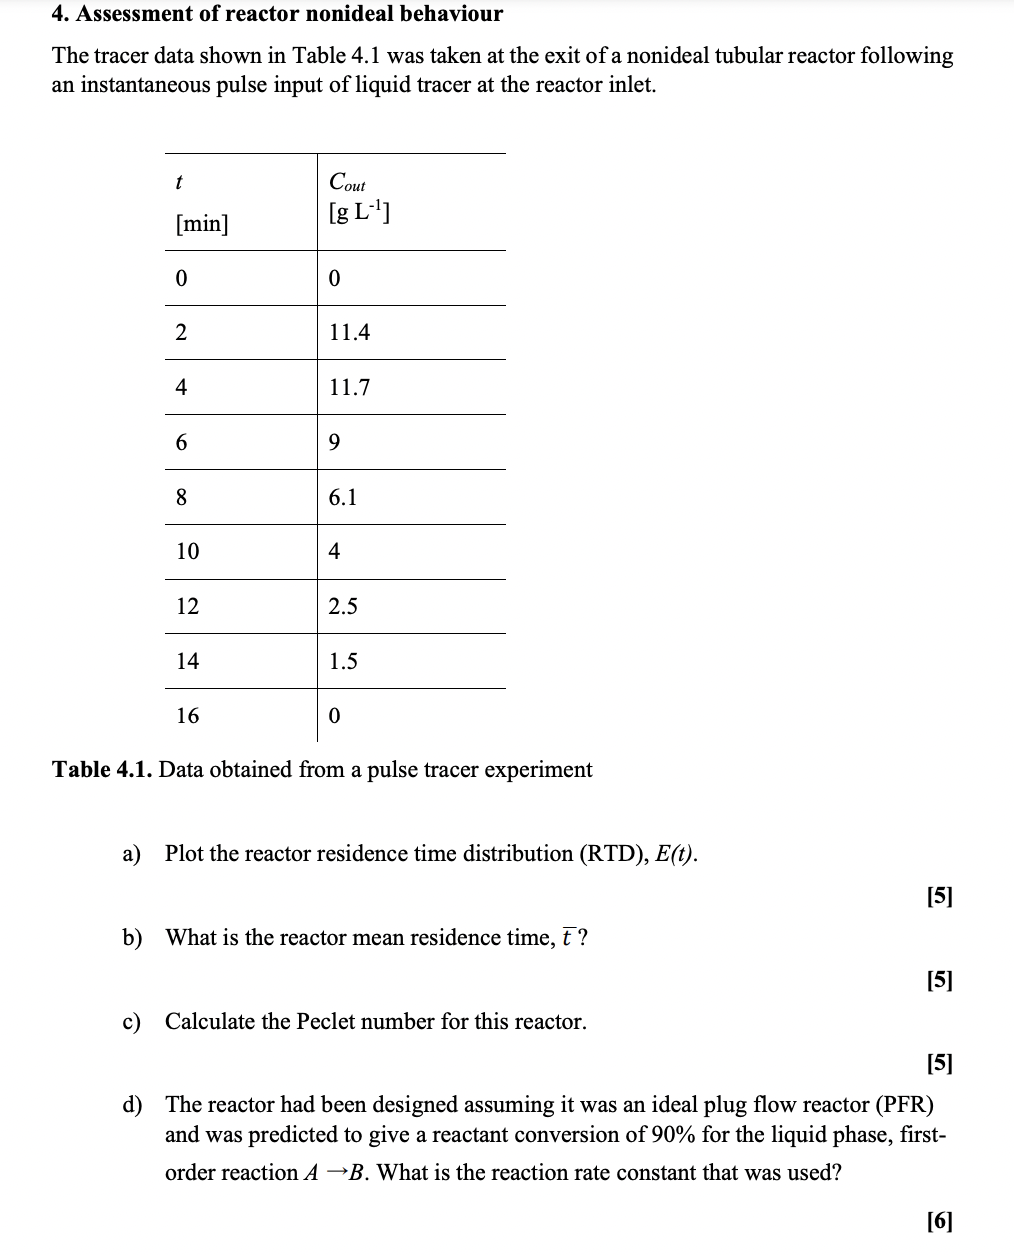
4. Assessment of reactor nonideal behaviour The tracer data shown in Table 4.1 was taken at the exit of a nonideal tubular reactor following an instantaneous pulse input of liquid tracer at the reactor inlet. t Cout [g Lº'] [min] 0 0 2 11.4 4 11.7 6 9 8 6.1 10 4 12 2.5 14 1.5 16 0 Table 4.1. Data obtained from a pulse tracer experiment a) Plot the reactor residence time distribution (RTD), E(t). [5] b) What is the reactor mean residence time, t? [5] c) Calculate the Peclet number for this reactor. [5] d) The reactor had been designed assuming it was an ideal plug flow reactor (PFR) and was predicted to give a reactant conversion of 90% for the liquid phase, first- order reaction A B. What is the reaction rate constant that was used? [6]
e) What conversion will actually be achieved by the nonideal tubular reactor? [6] f) What generalisations can you make by studying this problem? [3] State any assumptions you are making clearly.