Page 1 of 1
YOUR TASK (GROUP ODD): . To plot a graph (compaction curve) of dry density versus moisture content of Soil Specimen give
Posted: Sat May 21, 2022 12:22 pm
by answerhappygod
- Your Task Group Odd To Plot A Graph Compaction Curve Of Dry Density Versus Moisture Content Of Soil Specimen Give 1 (78.49 KiB) Viewed 22 times

- Your Task Group Odd To Plot A Graph Compaction Curve Of Dry Density Versus Moisture Content Of Soil Specimen Give 2 (78.49 KiB) Viewed 22 times
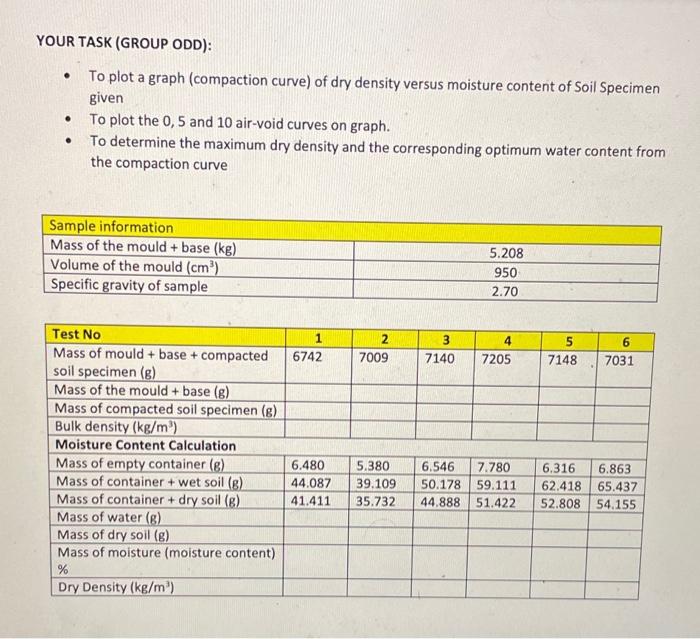
YOUR TASK (GROUP ODD): . To plot a graph (compaction curve) of dry density versus moisture content of Soil Specimen given • To plot the 0,5 and 10 air-void curves on graph. To determine the maximum dry density and the corresponding optimum water content from the compaction curve . Sample information Mass of the mould + base (kg) Volume of the mould (cm) Specific gravity of sample 5.208 950 2.70 6742 2 7009 3 7140 4 7205 5 7148 6 7031 Test No Mass of mould + base + compacted soil specimen (8) Mass of the mould + base (B) Mass of compacted soil specimen (8) Bulk density (kg/m) Moisture Content Calculation Mass of empty container (8) Mass of container + wet soil (8) Mass of container + dry soil (8) Mass of water (8) Mass of dry soil (8) Mass of moisture (moisture content) % Dry Density (kg/m) 6.480 44.087 41.411 5.380 39.109 35.732 6.546 7.780 50.178 59.111 44.888 51.422 6.316 6.863 62.418 65,437 52.808 54.155