Page 1 of 1
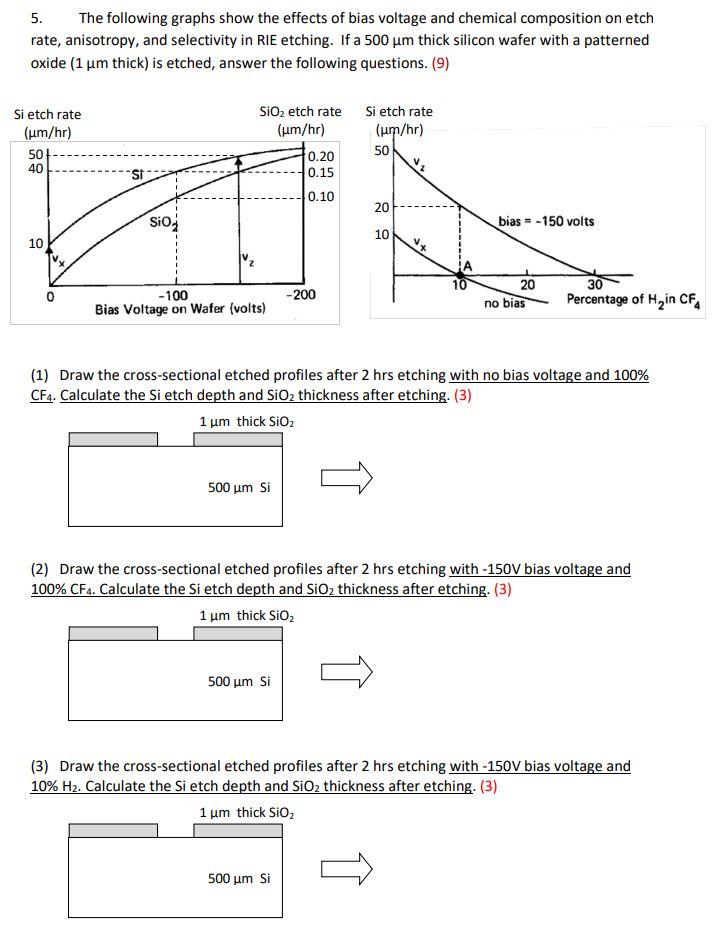
5. The following graphs show the effects of bias voltage and chemical composition on etch rate, anisotropy, and selectiv
Posted: Sat May 21, 2022 11:22 am
by answerhappygod
- 5 The Following Graphs Show The Effects Of Bias Voltage And Chemical Composition On Etch Rate Anisotropy And Selectiv 1 (84.32 KiB) Viewed 19 times
5. The following graphs show the effects of bias voltage and chemical composition on etch rate, anisotropy, and selectivity in RIE etching. If a 500 um thick silicon wafer with a patterned oxide (1 um thick) is etched, answer the following questions. (9) Si etch rate (um/hr) 50+ 40 SiO2 etch rate Si etch rate (um/hr) (um/hr) 0.20 50 0.15 0.10 20 Siod bias = -150 volts 10 10 X 10 -100 -200 20 no bias 30 Percentage of H in CFA Bias Voltage on Wafer (volts) (1) Draw the cross-sectional etched profiles after 2 hrs etching with no bias voltage and 100% CF4. Calculate the Si etch depth and SiOz thickness after etching. (3) 1 um thick SiO2 500 um si (2) Draw the cross-sectional etched profiles after 2 hrs etching with -150V bias voltage and 100% CF4. Calculate the Si etch depth and SiO2 thickness after etching. (3) 1 um thick SiO2 500 um si (3) Draw the cross-sectional etched profiles after 2 hrs etching with -150V bias voltage and 10% H2. Calculate the Si etch depth and SiO2 thickness after etching. (3) 1 um thick Sio 500 um Si