Page 1 of 1
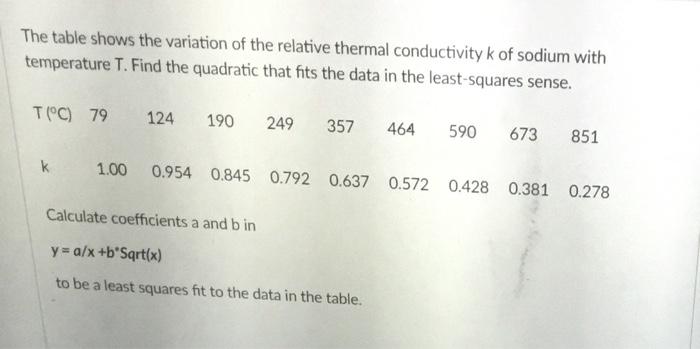
The table shows the variation of the relative thermal conductivity k of sodium with temperature T. Find the quadratic th
Posted: Sat May 21, 2022 10:24 am
by answerhappygod
- The Table Shows The Variation Of The Relative Thermal Conductivity K Of Sodium With Temperature T Find The Quadratic Th 1 (23.76 KiB) Viewed 21 times
The table shows the variation of the relative thermal conductivity k of sodium with temperature T. Find the quadratic that fits the data in the least-squares sense. T(C) 79 124 190 249 357 464 590 673 851 k 1.00 0.954 0.845 0.792 0.637 0.572 0.428 0.381 0.278 Calculate coefficients a and bin y=a/x+b'Sqrt(x) to be a least squares fit to the data in the table. a