Page 1 of 1
Frequency response: = The circuit in the figure is biased with IC1 = 1C2 = 800 HA. The transistors are the same, with IS
Posted: Sat May 21, 2022 12:33 am
by answerhappygod
- Frequency Response The Circuit In The Figure Is Biased With Ic1 1c2 800 Ha The Transistors Are The Same With Is 1 (48.89 KiB) Viewed 29 times
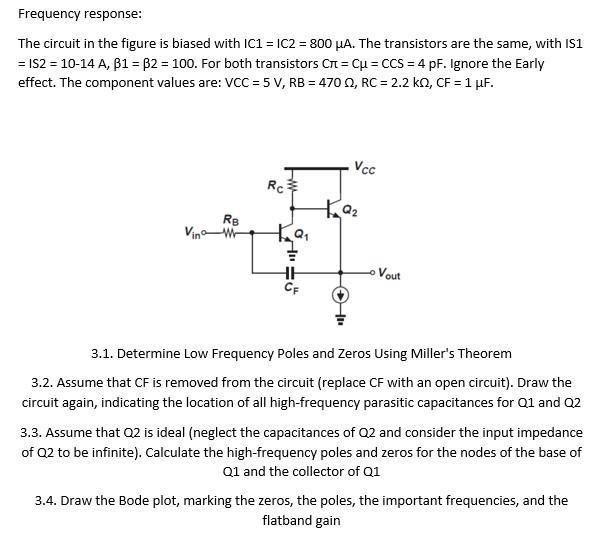
Frequency response: = The circuit in the figure is biased with IC1 = 1C2 = 800 HA. The transistors are the same, with IS1 = 152 = 10-14 A, B1 = B2 = 100. For both transistors CA = Cu = CCS = 4 pF. Ignore the Early effect. The component values are: VCC = 5 V, RB = 470, RC = 2.2 kN, CF = 1 uF. Vcc w RB RC tar ta, Vin HH • Vout 3.1. Determine Low Frequency Poles and Zeros Using Miller's Theorem 3.2. Assume that CF is removed from the circuit (replace CF with an open circuit). Draw the circuit again, indicating the location of all high-frequency parasitic capacitances for Q1 and 02 3.3. Assume that 02 is ideal (neglect the capacitances of Q2 and consider the input impedance of Q2 to be infinite). Calculate the high-frequency poles and zeros for the nodes of the base of Q1 and the collector of Q1 3.4. Draw the Bode plot, marking the zeros, the poles, the important frequencies, and the flatband gain