Page 1 of 1
Revenue The table shows the revenues y (in billions of dollars) for General Dynamics Corporation from 2008 through 2013.
Posted: Fri May 20, 2022 10:05 pm
by answerhappygod
- Revenue The Table Shows The Revenues Y In Billions Of Dollars For General Dynamics Corporation From 2008 Through 2013 1 (83.23 KiB) Viewed 28 times
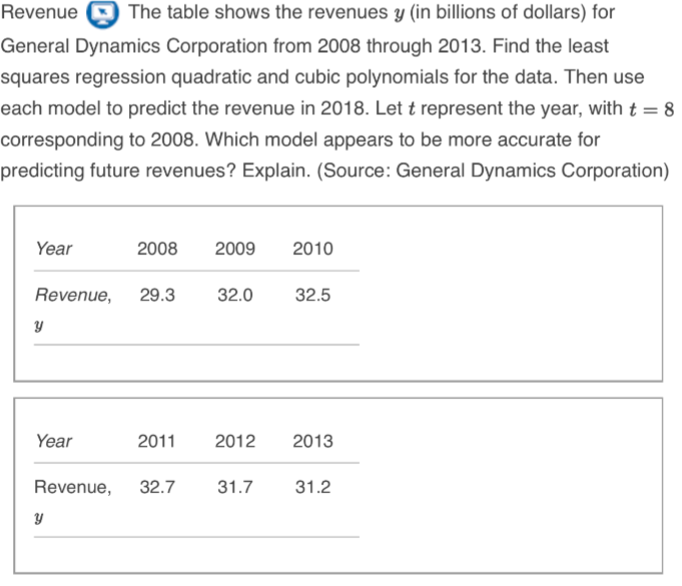
Revenue The table shows the revenues y (in billions of dollars) for General Dynamics Corporation from 2008 through 2013. Find the least squares regression quadratic and cubic polynomials for the data. Then use each model to predict the revenue in 2018. Let t represent the year, with t = 8 corresponding to 2008. Which model appears to be more accurate for predicting future revenues? Explain. (Source: General Dynamics Corporation) Year 2008 2009 2010 Revenue, 29.3 32.0 32.5 y Year 2011 2012 2013 32.7 31.7 31.2 Revenue, y