Page 1 of 1
There are A spectrum analyser's display of an FM signal is shown in Figure several pairs of sidebands with appreciable p
Posted: Fri May 20, 2022 7:07 pm
by answerhappygod
- There Are A Spectrum Analyser S Display Of An Fm Signal Is Shown In Figure Several Pairs Of Sidebands With Appreciable P 1 (74.95 KiB) Viewed 37 times
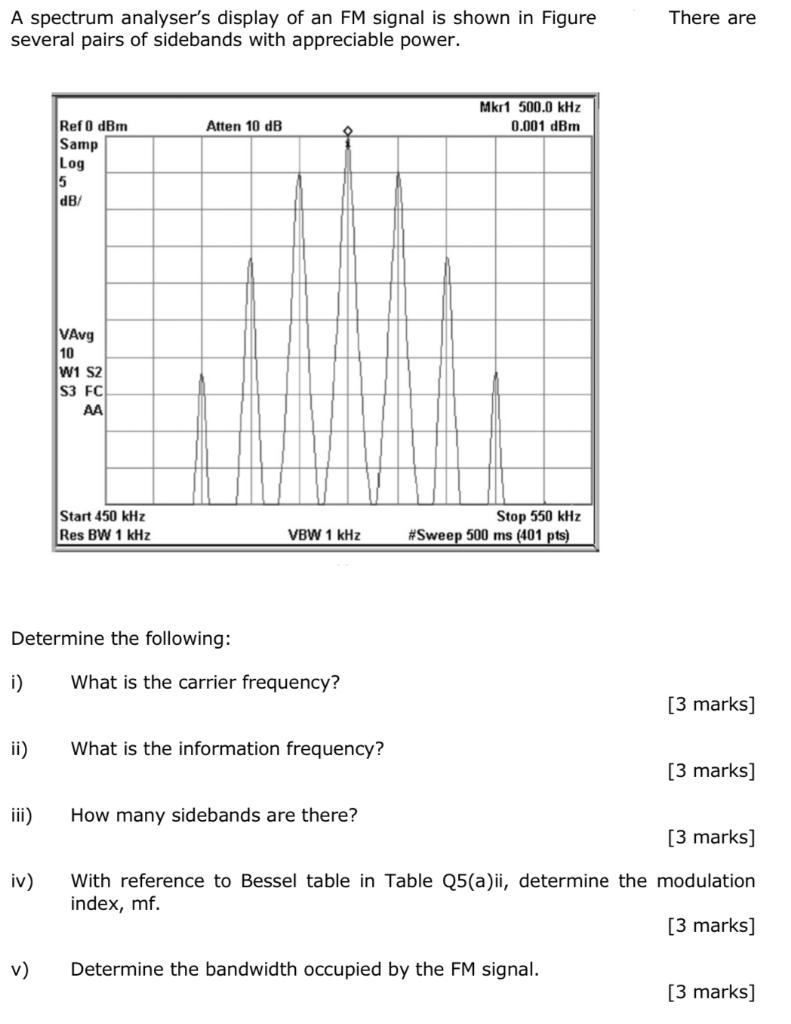
There are A spectrum analyser's display of an FM signal is shown in Figure several pairs of sidebands with appreciable power. Mkr 1 500.0 KHz 0.001 dBm Atten 10 dB Ref 0 dBm Samp Log 5 dB/ VAvg 10 W1 S2 S3 FC! AA Start 450 kHz Res BW 1 kHz VBW 1 kHz Stop 550 kHz #Sweep 500 ms (401 pts) Determine the following: i) What is the carrier frequency? [3 marks] ii) What is the information frequency? [3 marks] iii) How many sidebands are there? [3 marks] iv) With reference to Bessel table in Table Q5(a)ii, determine the modulation index, mf. [3 marks] v Determine the bandwidth occupied by the FM signal. [3 marks]