Page 1 of 1
100 oo O Positive data Negative data Decision boundary 20 8 o o o O 2x 10 20 0 o 100 120 The red circles represent the d
Posted: Fri May 20, 2022 6:18 pm
by answerhappygod
- 100 Oo O Positive Data Negative Data Decision Boundary 20 8 O O O O 2x 10 20 0 O 100 120 The Red Circles Represent The D 1 (157.15 KiB) Viewed 36 times
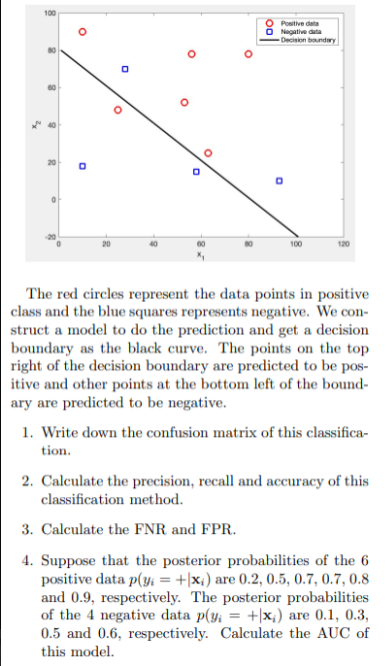
100 oo O Positive data Negative data Decision boundary 20 8 o o o O 2x 10 20 0 o 100 120 The red circles represent the data points in positive class and the blue squares represents negative. We con- struct a model to do the prediction and get a decision boundary as the black curve. The points on the top right of the decision boundary are predicted to be pos- itive and other points at the bottom left of the bound- ary are predicted to be negative. 1. Write down the confusion matrix of this classifica- tion. 2. Calculate the precision, recall and accuracy of this classification method. 3. Calculate the FNR and FPR. 4. Suppose that the posterior probabilities of the 6 positive data p(yi = +|xi) are 0.2, 0.5, 0.7, 0.7, 0.8 and 0.9, respectively. The posterior probabilities of the 4 negative data p(yi = + x) are 0.1, 0.3, 0.5 and 0.6, respectively. Calculate the AUC of this model.