Page 1 of 1
# -*- coding: utf-8 -*- # note: do not import other packages; my test script uses only these import numpy as np import p
Posted: Fri May 20, 2022 5:37 pm
by answerhappygod
- Coding Utf 8 Note Do Not Import Other Packages My Test Script Uses Only These Import Numpy As Np Import P 1 (61.06 KiB) Viewed 37 times
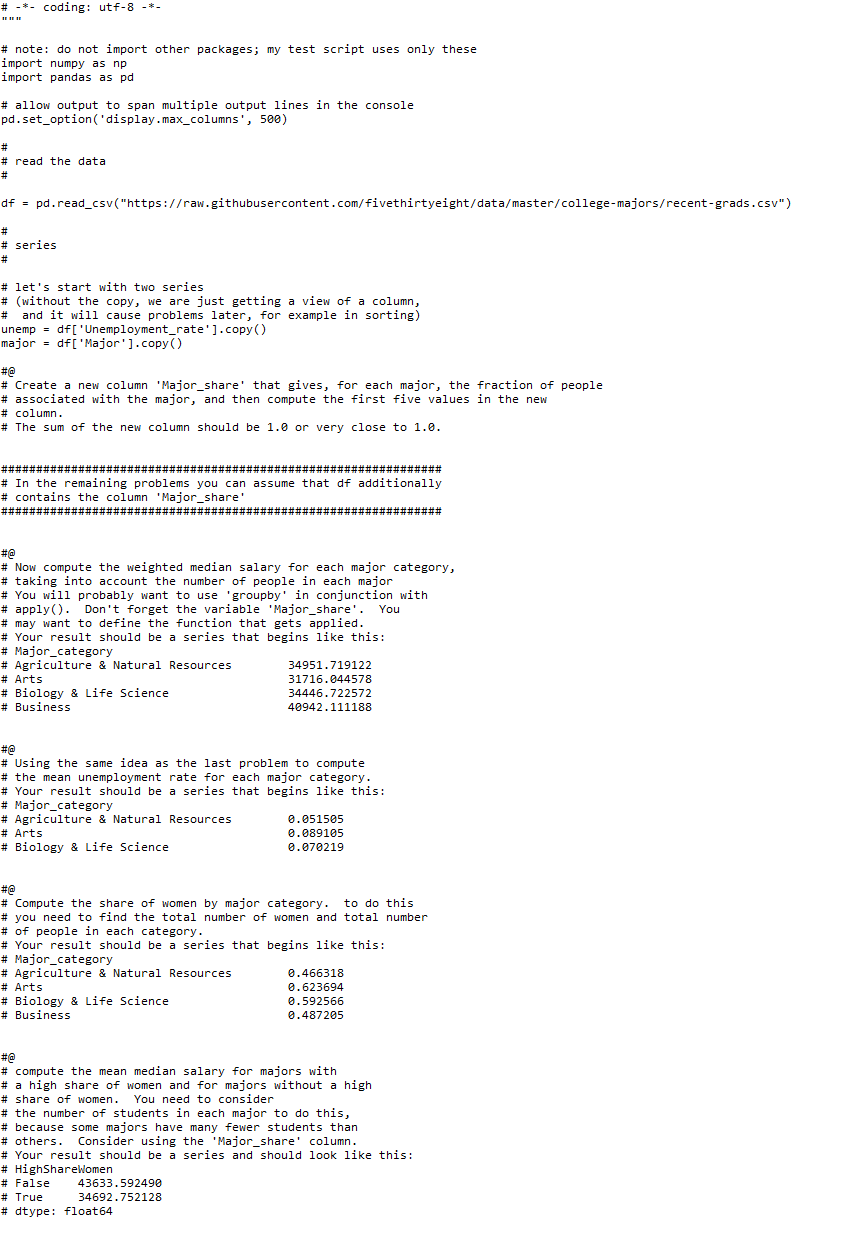
# -*- coding: utf-8 -*- # note: do not import other packages; my test script uses only these import numpy as np import pandas as pd # allow output to span multiple output lines in the console pd.set_option('display.max_columns', 500) # # read the data # df = pd.read_csv ("
https://raw.githubusercontent.com/fivet ... -grads.csv") # # series # # let's start with two series # (without the copy, we are just getting a view of a column, # and it will cause problems later, for example in sorting) unemp = df['Unemployment_rate'].copy) major = df['Major']. copy [) = #@ # Create a new column 'Major_share' that gives, for each major, the fraction of people # associated with the major, and then compute the first five values in the new # column # The sum of the new column should be 1.0 or very close to 1.0. ############################################################### # In the remaining problems you can assume that df additionally # contains the column 'Major_share' ############################################################### #@ # Now compute the weighted median salary for each major category, # taking into account the number of people in each major # You will probably want to use 'groupby' in conjunction with # apply(). Don't forget the variable 'Major_share'. You # may want to define the function that gets applied. # Your result should be a series that begins like this: # Major_category # Agriculture & Natural Resources 34951.719122 # Arts 31716.044578 # Biology & Life Science 34446.722572 # Business 40942.111188 #@ # Using the same idea as the last problem to compute # the mean unemployment rate for each major category. # Your result should be a series that begins like this: # Major_category # Agriculture & Natural Resources 0.051505 # Arts 0.089105 # Biology & Life Science 0.070219 #@ # Compute the share of women by major category. to do this # you need to find the total number of women and total number # of people in each category. # Your result should be a series that begins like this: # Major_category # Agriculture & Natural Resources 0.466318 # Arts 0.623694 # Biology & Life Science 0.592566 # Business 0.487205 #@ # compute the mean median salary for majors with # a high share of women and for majors without a high # share of women. You need to consider # the number of students in each major to do this, # because some majors have many fewer students than # others. Consider using the 'Major_share' column. # Your result should be a series and should look like this: # HighShareWomen # False 43633.592490 # True 34692.752128 # dtype: float 64