Page 1 of 1
# -*- coding: utf-8 -*- 1 1 1 # note: do not import other packages; my test script uses only these import numpy as np im
Posted: Fri May 20, 2022 5:14 pm
by answerhappygod
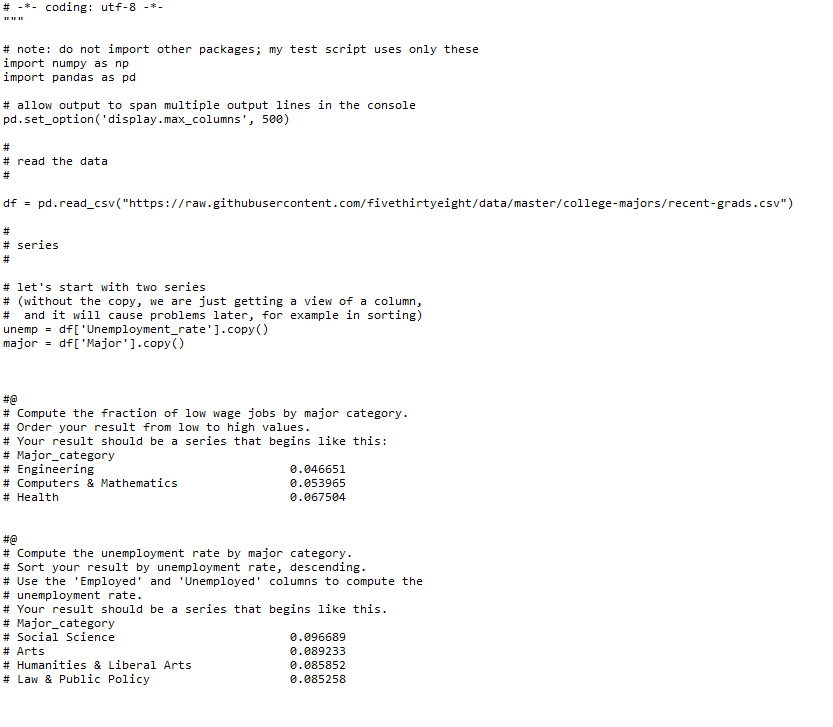
- Coding Utf 8 1 1 1 Note Do Not Import Other Packages My Test Script Uses Only These Import Numpy As Np Im 1 (31.26 KiB) Viewed 39 times
# -*- coding: utf-8 -*- 1 1 1 # note: do not import other packages; my test script uses only these import numpy as np import pandas as pd # allow output to span multiple output lines in the console pd.set_option('display.max_columns', 500) # # read the data # df = pd.read_csv("
https://raw.githubusercontent.com/fivet ... -grads.csv") # # series # # # let's start with two series # (without the copy, we are just getting a view of a column, and it will cause problems later, for example in sorting) unemp = df['Unemployment_rate'].copy() major = df['Major'].copy() # #@ # Compute the fraction of low wage jobs by major category. # Order your result from low to high values. # Your result should be a series that begins like this: # Major_category # Engineering 0.046651 # Computers & Mathematics 0.053965 # Health 0.067504 #@ # Compute the unemployment rate by major category. # Sort your result by unemployment rate, descending. # Use the 'Employed' and 'Unemployed' columns to compute the # unemployment rate. # Your result should be a series that begins like this. # Major_category # Social Science 0.096689 # Arts 0.089233 # Humanities & Liberal Arts 0.085852 # Law & Public Policy 0.085258