- Coding Utf 8 Note Do Not Import Other Packages My Test Script Uses Only These Import Numpy As Np Import P 1 (59.32 KiB) Viewed 58 times
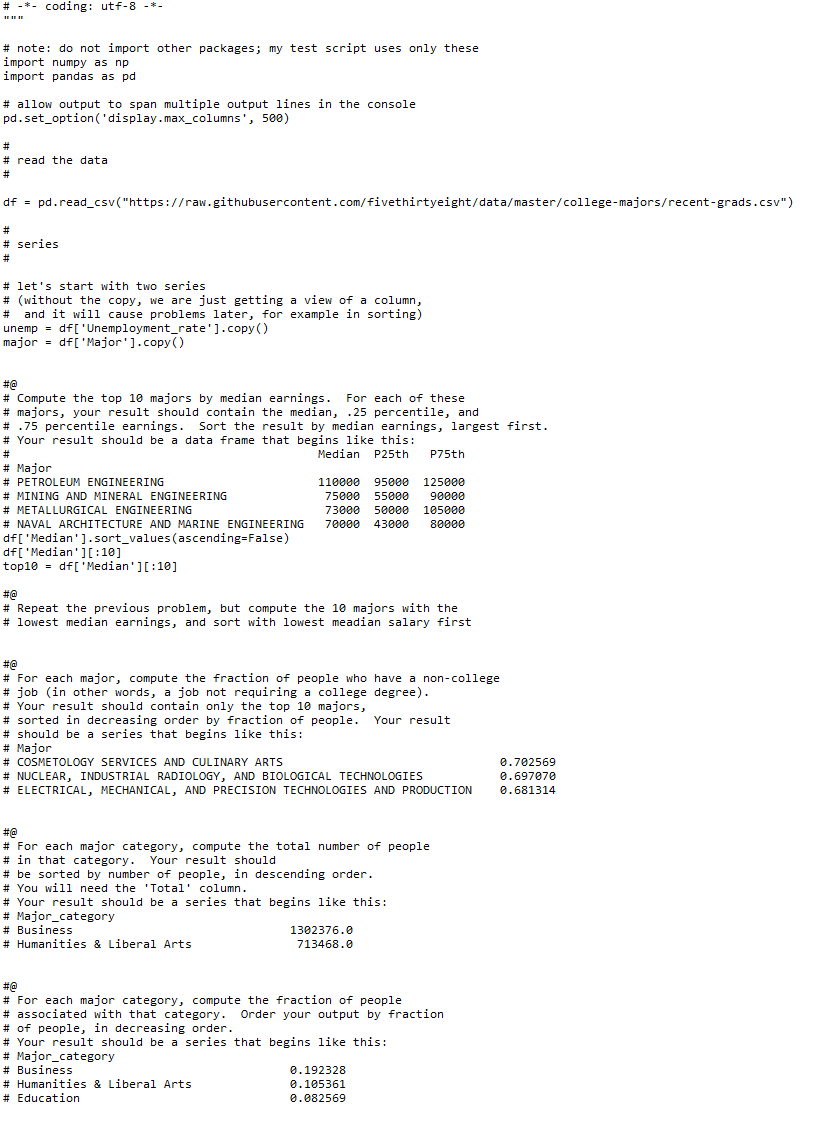
# -*- coding: utf-8 -*- # note: do not import other packages; my test script uses only these import numpy as np import pandas as pd # allow output to span multiple output lines in the console pd.set_option('display.max_columns', 500) # # read the data # df = pd.read_csv("
https://raw.githubusercontent.com/fivet ... -grads.csv") # # series # # let's start with two series # (without the copy, we are just getting a view of a column, # and it will cause problems later, for example in sorting) unemp = df ['Unemployment_rate'].copy() = major = df['Major'].copy() # #@ # Compute the top 10 majors by median earnings. For each of these # majors, your result should contain the median, .25 percentile, and # .75 percentile earnings. Sort the result by median earnings, largest first. # Your result should be a data frame that begins like this: Median P25th P75th # Major # PETROLEUM ENGINEERING 110000 95000 125000 # MINING AND MINERAL ENGINEERING 75000 55000 90000 # METALLURGICAL ENGINEERING 73000 50000 105000 # NAVAL ARCHITECTURE AND MARINE ENGINEERING 70000 43000 df['Median'].sort_values(ascending=False) df['Median'][:10] top10 = df['Median'][:10] [' 8eeee #@ # Repeat the previous problem, but compute the 10 majors with the # lowest median earnings, and sort with lowest meadian salary first #@ # For each major, compute the fraction of people who have a non-college # job (in other words, a job not requiring a college degree). # Your result should contain only the top 10 majors, # sorted in decreasing order by fraction of people. Your result # should be a series that begins like this: # Major # COSMETOLOGY SERVICES AND CULINARY ARTS 0.702569 # NUCLEAR, INDUSTRIAL RADIOLOGY, AND BIOLOGICAL TECHNOLOGIES 0.697070 # ELECTRICAL, MECHANICAL, AND PRECISION TECHNOLOGIES AND PRODUCTION 0.681314 #@ # For each major category, compute the total number of people # in that category. Your result should # be sorted by number of people, in descending order. # You will need the 'Total' column. # Your result should be a series that begins like this: # Major_category # Business 1302376.0 # Humanities & Liberal Arts 713468.0 #@ # For each major category, compute the fraction of people # associated with that category. Order your output by fraction # of people, in decreasing order. # Your result should be a series that begins like this: # Major_category # Business 0.192328 # Humanities & Liberal Arts 0.105361 # Education 0.082569