Page 1 of 1
1. Create a random dice roll simulation that simulates rolling a single dice 10000 times. Run simulation and count the f
Posted: Fri May 20, 2022 2:38 pm
by answerhappygod
- 1 Create A Random Dice Roll Simulation That Simulates Rolling A Single Dice 10000 Times Run Simulation And Count The F 1 (176.61 KiB) Viewed 28 times
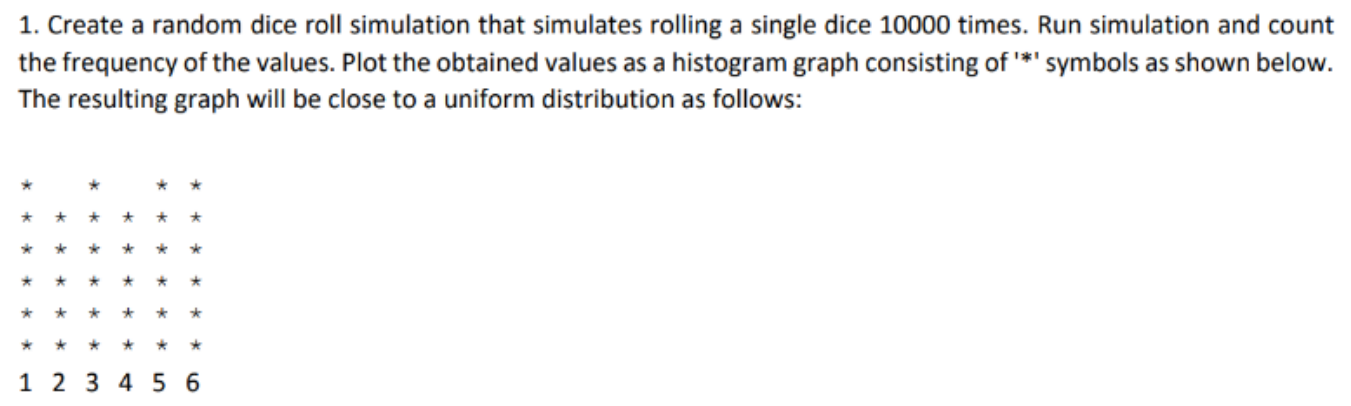
1. Create a random dice roll simulation that simulates rolling a single dice 10000 times. Run simulation and count the frequency of the values. Plot the obtained values as a histogram graph consisting of '*' symbols as shown below. The resulting graph will be close to a uniform distribution as follows: a * * * * * * * * * * * * * * * * * * * * * 1 2 3 4 5 6