Page 1 of 1
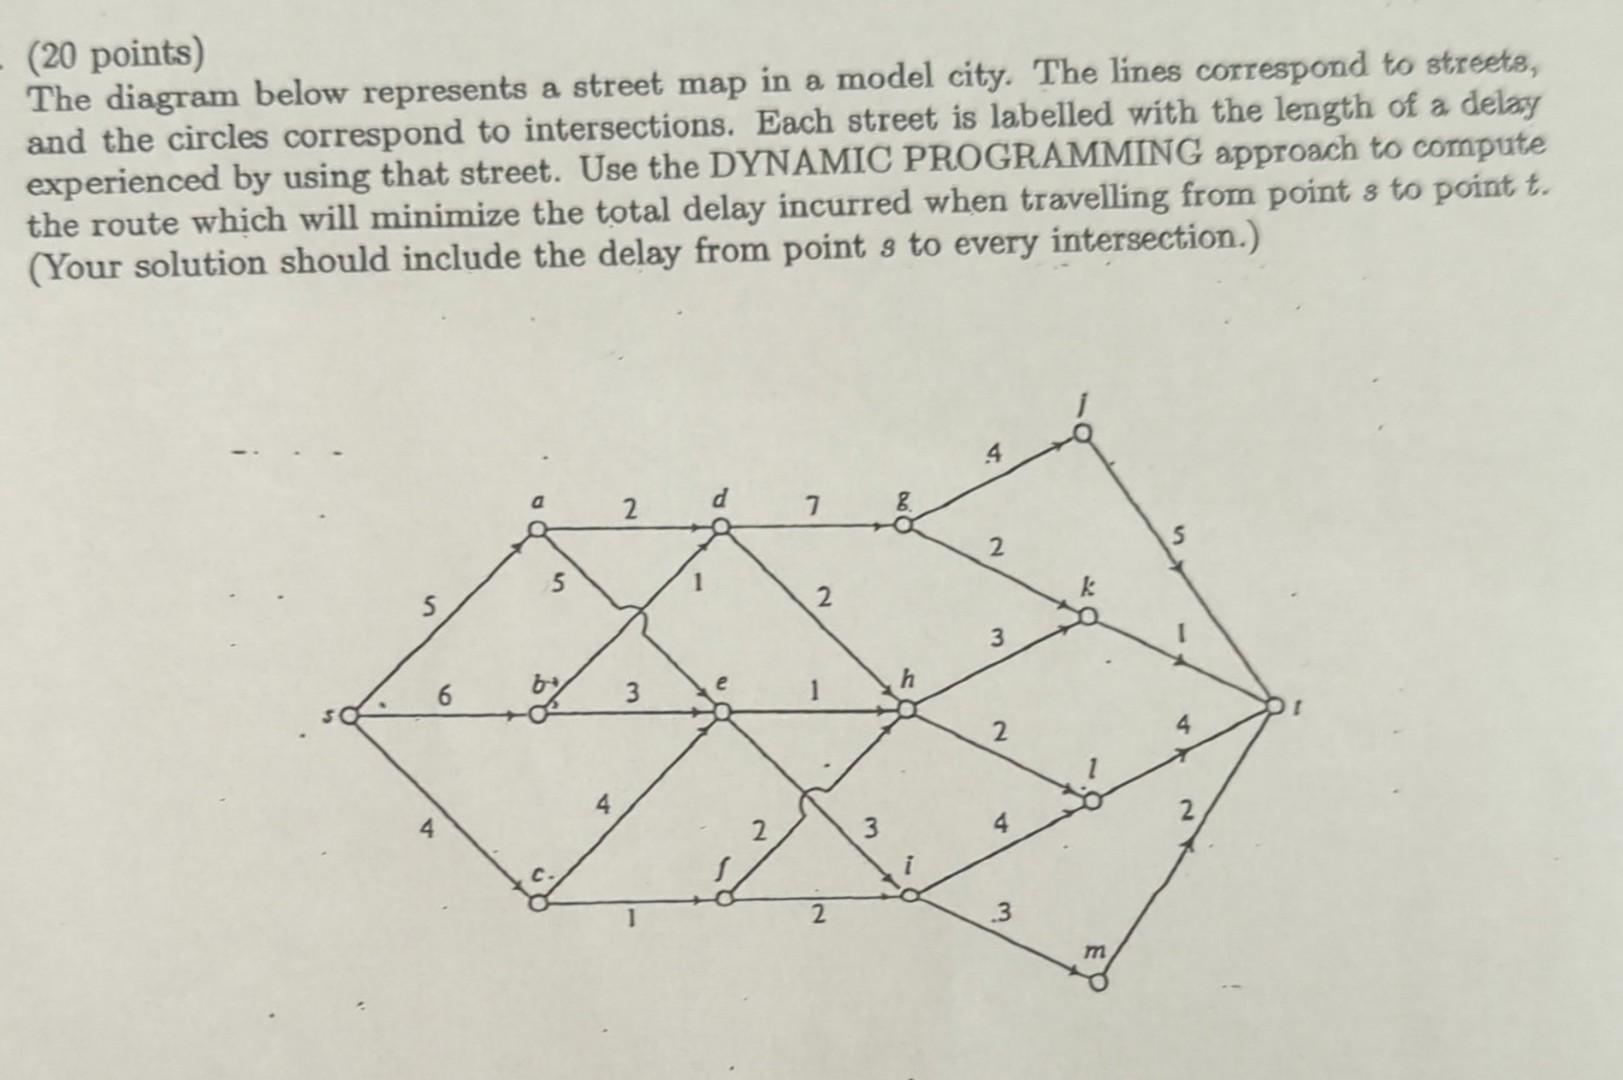
(20 points) The diagram below represents a street map in a model city. The lines correspond to streets, and the circles
Posted: Fri May 20, 2022 1:37 pm
by answerhappygod
- 20 Points The Diagram Below Represents A Street Map In A Model City The Lines Correspond To Streets And The Circles 1 (107.62 KiB) Viewed 28 times
(20 points) The diagram below represents a street map in a model city. The lines correspond to streets, and the circles correspond to intersections. Each street is labelled with the length of a delay experienced by using that street. Use the DYNAMIC PROGRAMMING approach to compute the route which will minimize the total delay incurred when travelling from point s to point t. (Your solution should include the delay from point s to every intersection.) 4 a d 2 7 8 5 2 5. 1 N 3 6 3 2 4 2 3 4 c i 2 NI 3 m