Page 1 of 1
Data Mining 1. Deriving ROC table and curve (slides chapter 4.92 and 4.93 in Tan's PPT, chapter 4). Here 4.92 means slid
Posted: Fri May 20, 2022 12:26 pm
by answerhappygod
- Data Mining 1 Deriving Roc Table And Curve Slides Chapter 4 92 And 4 93 In Tan S Ppt Chapter 4 Here 4 92 Means Slid 1 (95.32 KiB) Viewed 50 times
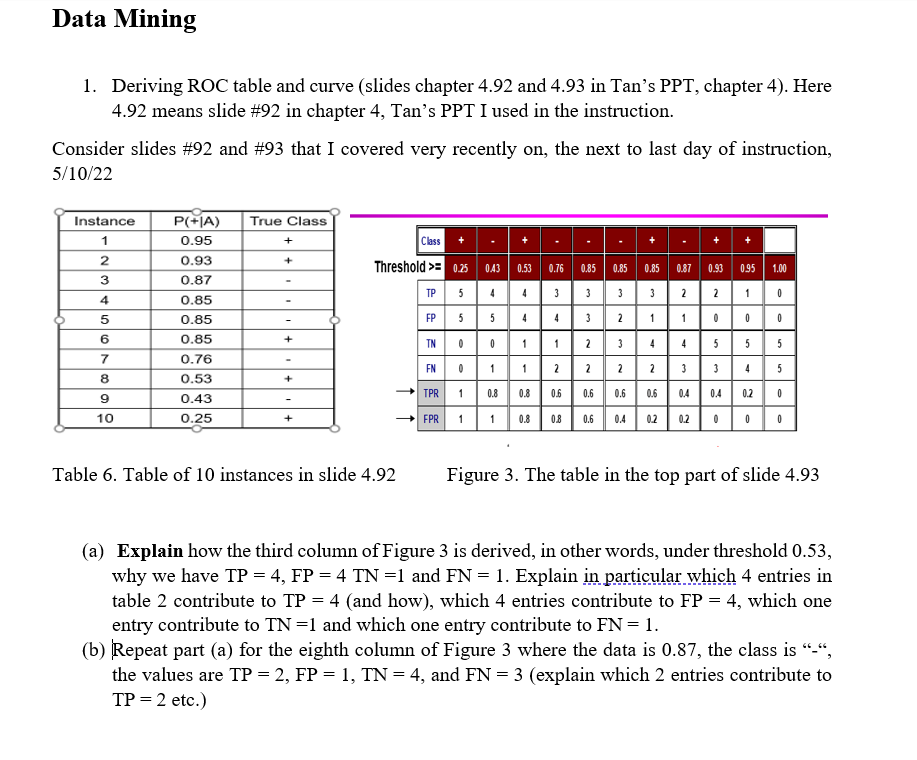
Data Mining 1. Deriving ROC table and curve (slides chapter 4.92 and 4.93 in Tan's PPT, chapter 4). Here 4.92 means slide #92 in chapter 4, Tan's PPT I used in the instruction. Consider slides #92 and #93 that I covered very recently on the next to last day of instruction, 5/10/22 Instance 1 True Class + + + - + + 2 P(+1A) 0.95 0.93 0.87 0.85 + 0.85 0.85 0.85 095 1.00 3 بي 3 0 4 5 1 Class Threshold >= 0.25 0.43 0.53 0.76 0.87 0.93 TP | 5 | 4 4 221 FP 554 4 TN 00112 344 555 EN 01122223345 TPR 1 08 08 0.8 0.8 0.6 0.6 0.6 0.6 0.4 0.4 0.2 02 6 + 0.85 0.85 0.76 0.53 0.43 0.25 7 8 + 0 9 † 1 10 FPR 1 1 0.8 0.8 0.6 0.4 0.2 0 0 0 Table 6. Table of 10 instances in slide 4.92 Figure 3. The table in the top part of slide 4.93 (a) Explain how the third column of Figure 3 is derived, in other words, under threshold 0.53, why we have TP = 4, FP = 4 TN =1 and FN = 1. Explain in particular which 4 entries in table 2 contribute to TP = 4 (and how), which 4 entries contribute to FP = 4, which one entry contribute to TN =1 and which one entry contribute to FN = 1. (b) Repeat part (a) for the eighth column of Figure 3 where the data is 0.87, the class is “-“, the values are TP = 2, FP = 1, TN = 4, and FN = 3 (explain which 2 entries contribute to TP = 2 etc.)