Page 1 of 1
Consider the figure below, which plots the evolution of TCP's congestion window at the beginning of each time unit (wher
Posted: Fri May 20, 2022 11:43 am
by answerhappygod
- Consider The Figure Below Which Plots The Evolution Of Tcp S Congestion Window At The Beginning Of Each Time Unit Wher 1 (473.85 KiB) Viewed 58 times
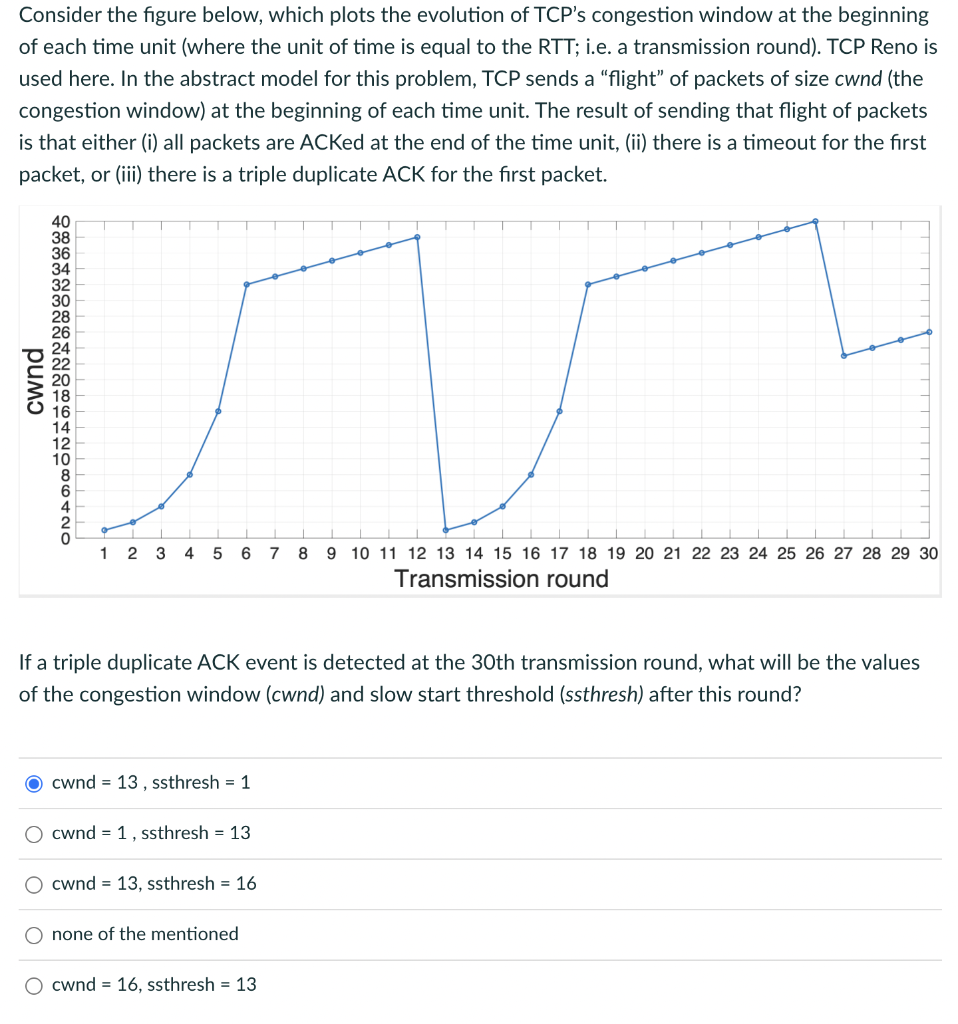
Consider the figure below, which plots the evolution of TCP's congestion window at the beginning of each time unit (where the unit of time is equal to the RTT; i.e. a transmission round). TCP Reno is used here. In the abstract model for this problem, TCP sends a “flight” of packets of size cwnd (the congestion window) at the beginning of each time unit. The result of sending that flight of packets is that either (i) all packets are ACKed at the end of the time unit, (ii) there is a timeout for the first packet, or (iii) there is a triple duplicate ACK for the first packet. 40 38 36 cwnd 12 10 2 1 2 3 4 5 6 7 8 9 10 11 12 13 14 15 16 17 18 19 20 21 22 23 24 25 26 27 28 29 30 Transmission round If a triple duplicate ACK event is detected at the 30th transmission round, what will be the values of the congestion window (cwnd) and slow start threshold (ssthresh) after this round? O cwnd = 13, ssthresh = 1 cwnd = 1, ssthresh = 13 O cwnd = 13, ssthresh = 16 O none of the mentioned O cwnd = 16, ssthresh = 13