Page 1 of 1
AON network diagram: B E H Normal Time (weeks) Crash Time (weeks) Normal Cost ($) Maximum weeks Reduced Crash Cost ($) A
Posted: Fri May 20, 2022 7:50 am
by answerhappygod
- Aon Network Diagram B E H Normal Time Weeks Crash Time Weeks Normal Cost Maximum Weeks Reduced Crash Cost A 1 (81.92 KiB) Viewed 52 times
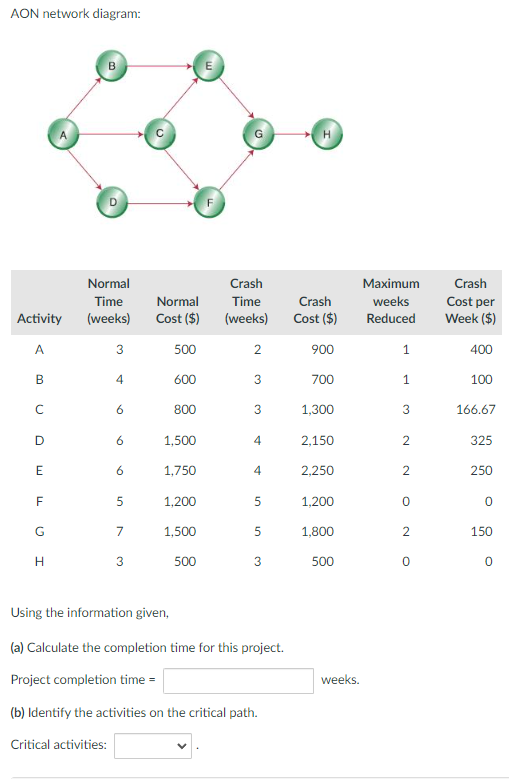
AON network diagram: B E H Normal Time (weeks) Crash Time (weeks) Normal Cost ($) Maximum weeks Reduced Crash Cost ($) Activity Crash Cost per Week ($) A 3 500 2 900 1 400 B 4 600 3 700 1 100 C 6 800 3 1,300 3 166.67 D 6 1,500 4 2,150 2 325 E 6 1,750 4 2.250 N 2 250 F 5 1,200 5 1,200 0 0 F G 7 1,500 5 1,800 2 150 H 3 500 3 500 0 0 Using the information given, (a) Calculate the completion time for this project. Project completion time = weeks. (b) Identify the activities on the critical path. Critical activities: