Page 1 of 1
Q.3. A process chart produces bearing houses is controlled with a fraction nonconforming control char using sample size
Posted: Fri May 20, 2022 7:21 am
by answerhappygod
- Q 3 A Process Chart Produces Bearing Houses Is Controlled With A Fraction Nonconforming Control Char Using Sample Size 1 (42.47 KiB) Viewed 68 times
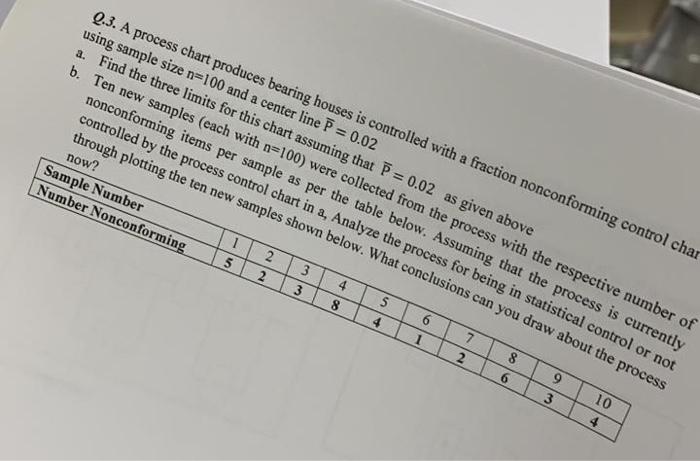
Q.3. A process chart produces bearing houses is controlled with a fraction nonconforming control char using sample size n=100 and a center line P = 0.02 a. Find the three limits for this chart assuming that P = 0.02 as given above b. Ten new samples (each with n=100) were collected from the process with the respective number of nonconforming items per sample as per the table below. Assuming that the process is currently controlled by the process control chart in a, Analyze the process for being in statistical control or not through plotting the ten new samples shown below. What conclusions can you draw about the process now? Sample Number 3 7 Number Nonconforming 2 1 2 4 8 5 6 2 8 6 9 3 10 4