- 1 (541.73 KiB) Viewed 63 times
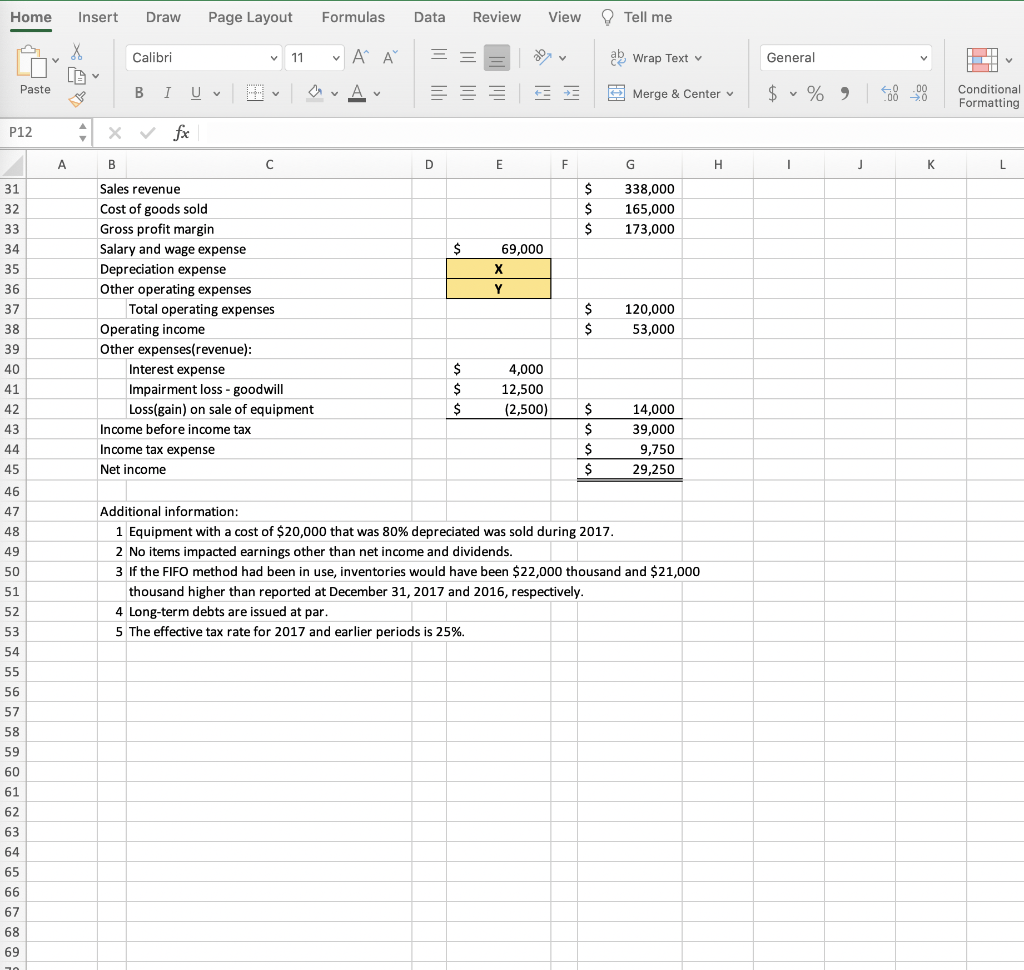
Home Insert Draw Page Layout Formulas Data Review View Tell me Х Calibri ✓ 11 ♥ A A ab Wrap Text General LAV Paste BIU a. Av < === = = Merge & Center $ v % 48 -08 Conditional Formatting P12 x ✓ fx A B с D E F G H 1 j K L $ $ $ 338,000 165,000 173,000 $ 31 32 33 34 35 36 37 38 69,000 х Y Sales revenue Cost of goods sold Gross profit margin Salary and wage expense Depreciation expense Other operating expenses Total operating expenses Operating income Other expenses(revenue): Interest expense Impairment loss - goodwill Loss(gain) on sale of equipment Income before income tax Income tax expense Net income $ $ 120,000 53,000 39 40 41 $ $ $ 4,000 12,500 (2,500) 42 43 $ $ $ $ 14,000 39,000 9,750 29,250 44 45 46 47 48 49 50 Additional information: 1 Equipment with a cost of $20,000 that was 80% depreciated was sold during 2017 2 No items impacted earnings other than net income and dividends. 3 If the FIFO method had been in use, inventories would have been $22,000 thousand and $21,000 thousand higher than reported at December 31, 2017 and 2016, respectively. 4 Long-term debts are issued at par. 5 The effective tax rate for 2017 and earlier periods is 25%. 51 52 53 54 55 56 57 58 59 60 61 62 63 64 65 66 67 68 69
For the next 6 Questions: Question 13 Not yet answered Points out of 8.00 Use the financial statements of STU Corporation. (The Excel file distributed on 5/9.) Assume all purchases and sales are on credit and there are 365 days in one year. Round to the first decimal place, such as 2345.6, if necessary. Find X and Y in the income statement, then calculate STU's cash flow from operating activities in 2017. Flag question thousand. Question 14 What amount of cash dividends did STU pay in 2017? (Note: Answer in a positive number.) Not yet answered thousand Points out of 8.00 Flag question Question 15 Calculate the STU's cash conversion cycle in 2017. Not yet answered days Points out of 8.00 P Flag question