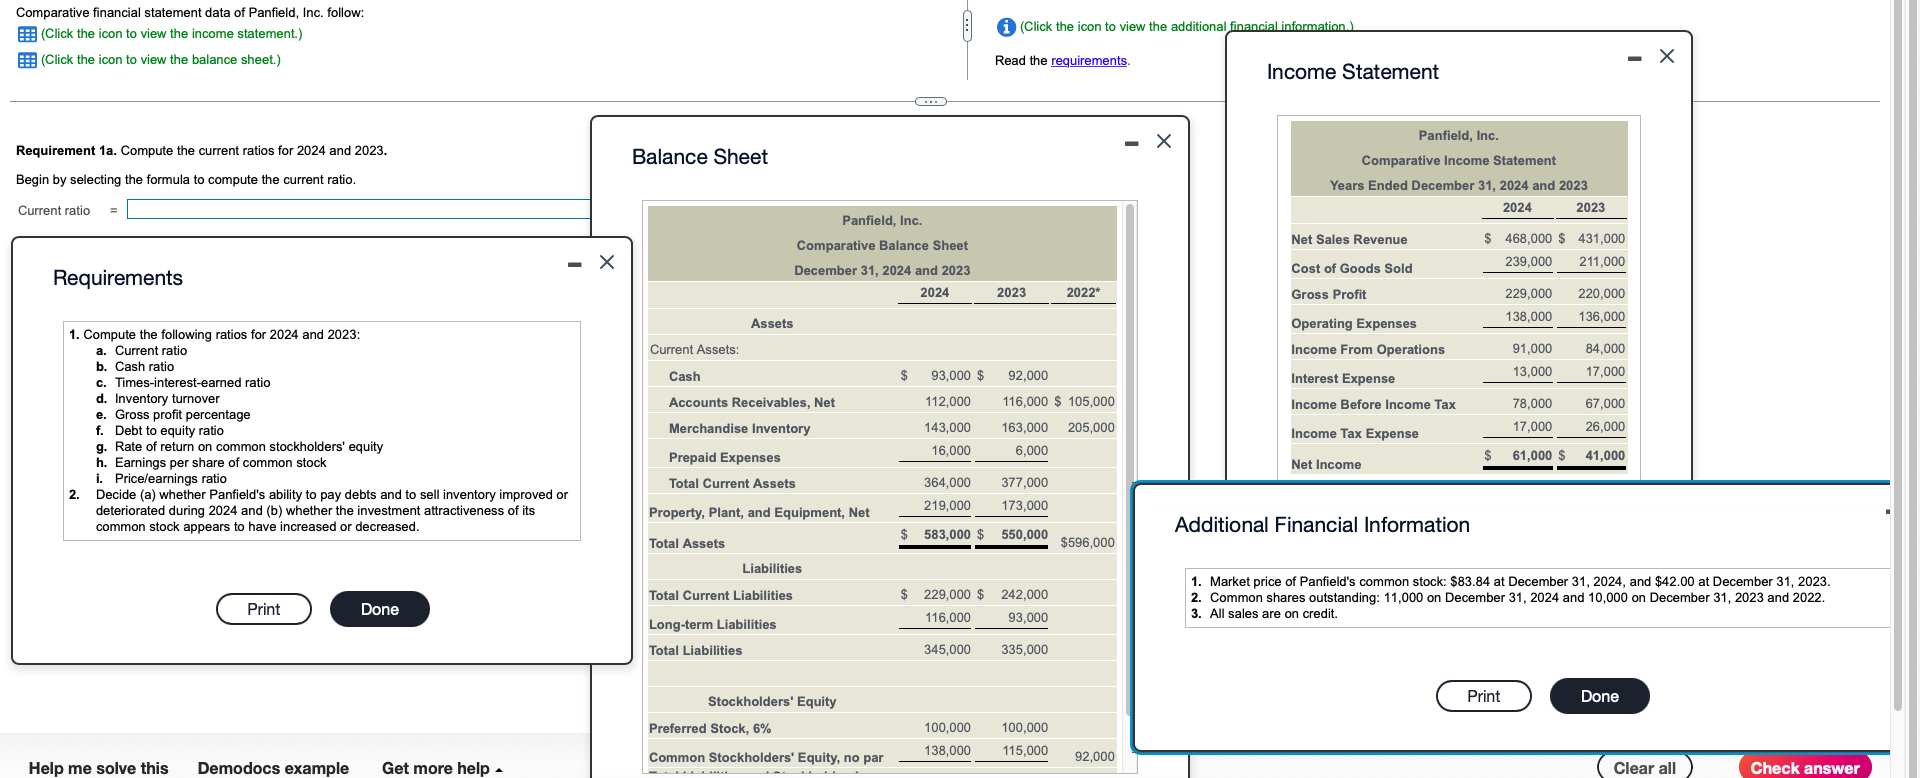
- Click The Icon To View The Additional Financial Information Comparative Financial Statement Data Of Panfield Inc Fo 1 (228.25 KiB) Viewed 65 times
(Click the icon to view the additional financial information.) Comparative financial statement data of Panfield, Inc. follow: 5: (Click the icon to view the income statement.) (Click the icon to view the balance sheet.) Read the requirements Income Statement . Х Requirement 1a. Compute the current ratios for 2024 and 2023. Balance Sheet Panfield, Inc. Comparative Income Statement Years Ended December 31, 2024 and 2023 2024 2023 Begin by selecting the formula to compute the current ratio. Current ratio = Panfield, Inc. $ Net Sales Revenue Comparative Balance Sheet 468,000 $ 431,000 239,000 211,000 х December 31, 2024 and 2023 Cost of Goods Sold Requirements 2024 2023 2022* Gross Profit 229,000 138,000 220,000 136,000 Assets Operating Expenses Income From Operations Current Assets: 91,000 84,000 Cash $ 92,000 Interest Expense 13,000 17,000 93,000 $ 112,000 Accounts Receivables, Net 116,000 $ 105,000 Income Before Income Tax 67,000 1. Compute the following ratios for 2024 and 2023: a. Current ratio b. Cash ratio c. Times-interest-earned ratio d. Inventory turnover e. Gross profit percentage f. Debt to equity ratio g. Rate of return on common stockholders' equity h. Earnings per stock i. Pricelearnings ratio 2. Decide (a) whether Panfield's ability to pay debts and to sell inventory improved or deteriorated during 2024 and (b) whether the investment attractiveness of its common stock appears to have increased or decreased. 78,000 17,000 Merchandise Inventory 143,000 205,000 26,000 163,000 6,000 Income Tax Expense 16,000 Prepaid Expenses $ 61,000 $ 41,000 Net Income Total Current Assets 364,000 219,000 377,000 173,000 Property, Plant, and Equipment, Net Additional Financial Information 583,000 $ 550,000 Total Assets $596,000 Liabilities Total Current Liabilities $ 229,000 $ 1. Market price of Panfield's common stock: $83.84 at December 31, 2024, and $42.00 at December 31, 2023. 2. Common shares outstanding: 11,000 on December 31, 2024 and 10,000 on December 31, 2023 and 2022. 3. All sales are on credit. Print 242,000 93,000 Done 116,000 Long-term Liabilities Total Liabilities 345,000 335,000 Stockholders' Equity Print Done 1 Preferred Stock, 6% 100,000 138,000 100,000 115,000 Common Stockholders' Equity, no par 92,000 Help me solve this Demodocs example Get more help Clear all Check answer