- The Mcconnell Department Stores Inc Chief Executive Officer Ceo Has Asked You To Compare The Company S Profit Perfor 1 (241.32 KiB) Viewed 48 times
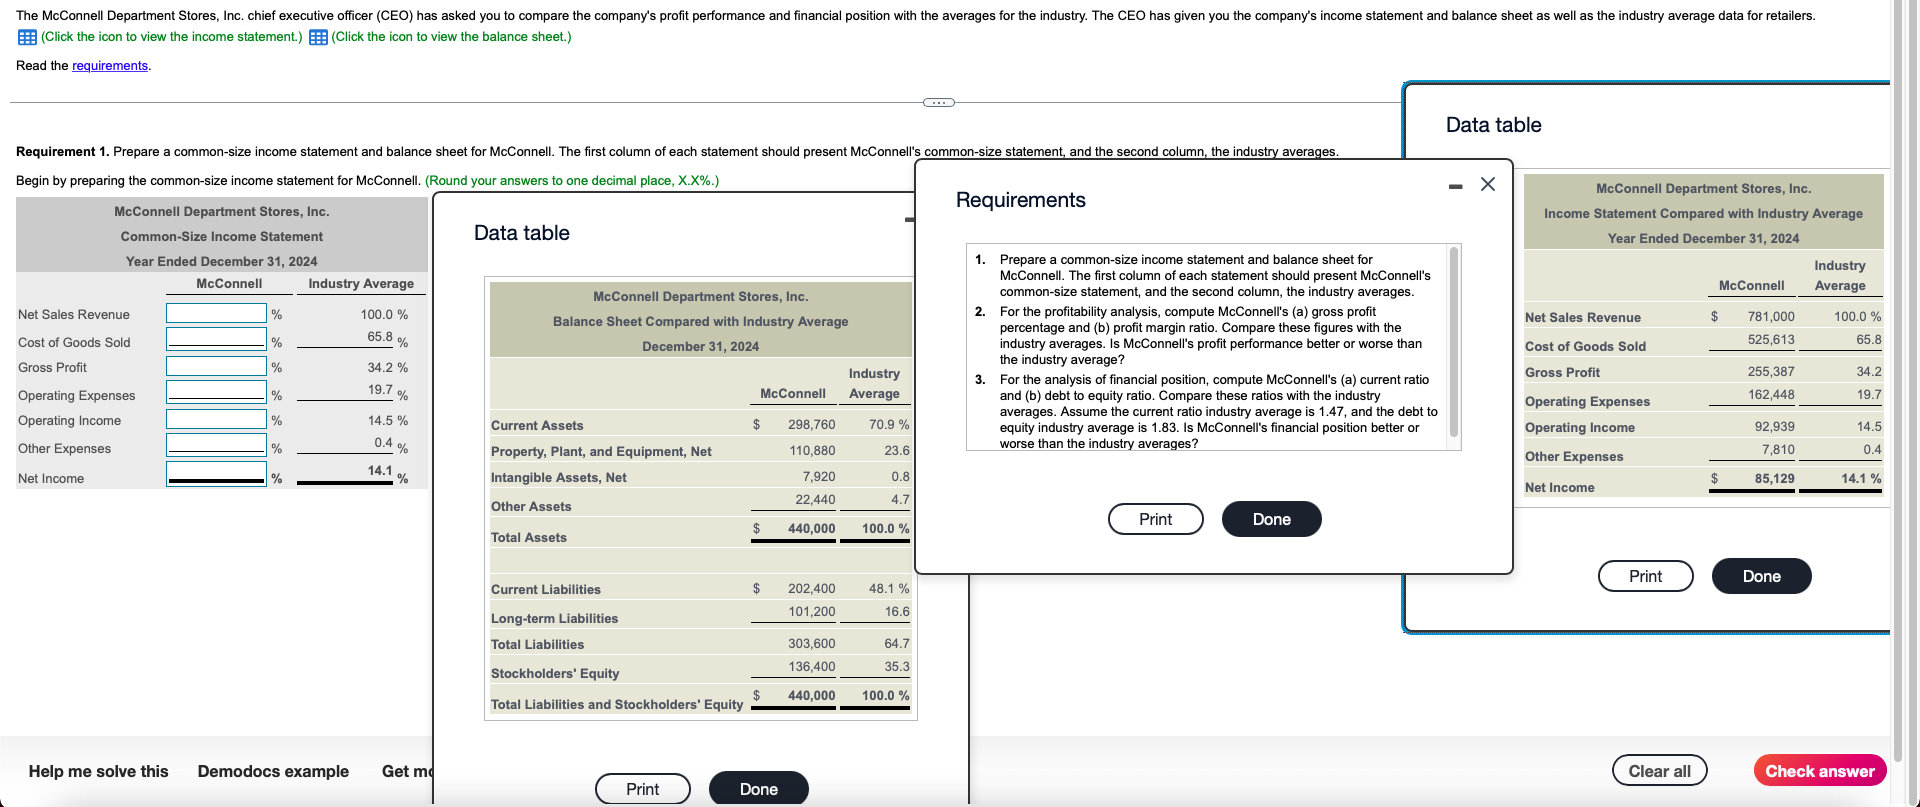
The McConnell Department Stores, Inc. chief executive officer (CEO) has asked you to compare the company's profit performance and financial position with the averages for the industry. The CEO has given you the company's income statement and balance sheet as well as the industry average data for retailers. E: (Click the icon to view the income statement) : (Click the icon to view the balance sheet.) Read the requirements. . Data table McConnell Department Stores, Inc. Income Statement Compared with Industry Average Year Ended December 31, 2024 Industry Average McConnell Net Sales Revenue $ 65.8 % Requirement 1. Prepare a common-size income statement and balance sheet for McConnell. The first column of each statement should present McConnell's common-size statement, and the second column, the industry averages. Begin by preparing the common-size income statement for McConnell. (Round your answers to one decimal place, X.X%.) Requirements McConnell Department Stores, Inc. Common-Size Income Statement Data table Year Ended December 31, 2024 1. Prepare a common-size income statement and balance sheet for McConnell. The first column of each statement should present McConnell's McConnell Industry Average McConnell Department Stores, Inc. common-size statement, and the second column, the industry averages. Net Sales Revenue % 100.0 % Balance Sheet Compared with Industry Average 2. For the profitability analysis, compute McConnell's (a) gross profit percentage and (b) profit margin ratio. Compare these figures with the Cost of Goods Sold % December 31, 2024 industry averages. Is McConnell's profit performance better or worse than Gross Profit % the industry average? 34.2 % Industry 3. For the analysis of financial position, compute McConnell's (a) current ratio Operating Expenses % 19.7 % McConnell Average and (b) debt to equity ratio. Compare these ratios with the industry averages. Assume the current ratio industry average is 1.47, and the debt to Operating Income % 14.5 % Current Assets $ 298,760 70.9 % equity industry average is 1.83. Is McConnell's financial position better or Other Expenses % 110,880 Property, Plant, and Equipment, Net 23.6 worse than the industry averages? 14.1 Net Income % % Intangible Assets, Net 7,920 0.8 4.7 Other Assets Print Done 440,000 100.0 % Total Assets 781,000 525,613 100.0 % 65.8 Cost of Goods Sold Gross Profit 255,387 162,448 34.2 19.7 Operating Expenses Operating Income Other Expenses 0.4% 92,939 7,810 14.5 0.4 $ 85,129 14.1 % Net Income 22,440 Print Done Current Liabilities 202,400 101,200 48.1 % 16.6 Long-term Liabilities Total Liabilities 64.7 303,600 136,400 35.3 Stockholders' Equity 440,000 100.0 % Total Liabilities and Stockholders' Equity Help me solve this Demodocs example Get mo Clear all Check answer Print Done