- Graphs Most Graphs In Economics Are Based On A Grid Bordered On The Left And Below By Two Perpendicular Lines That Show 1 (177.98 KiB) Viewed 58 times
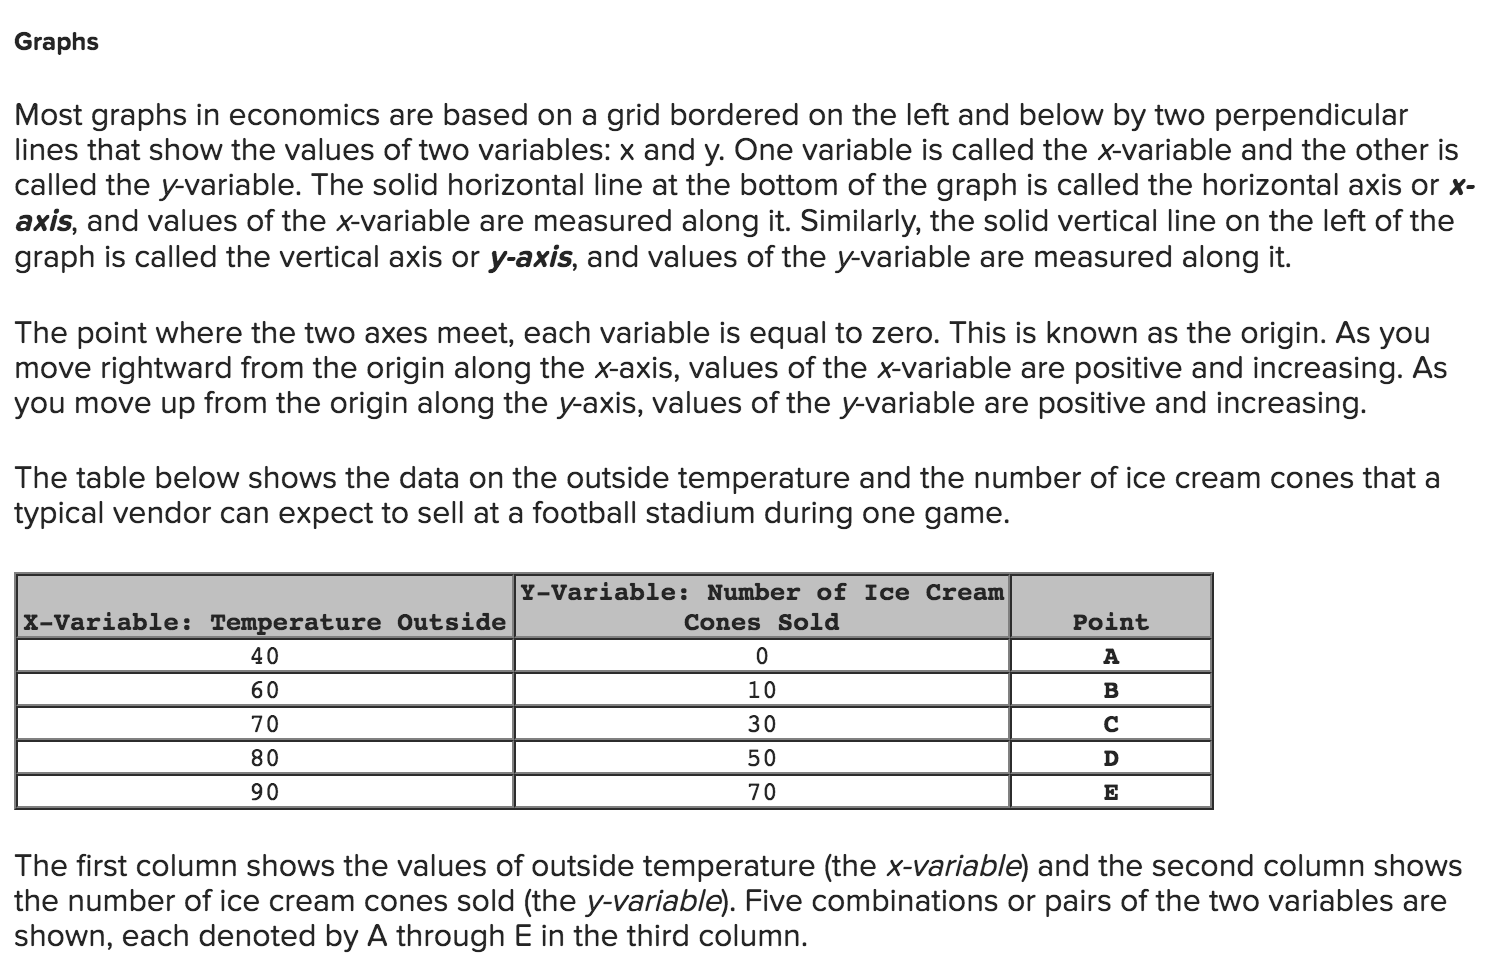
Graphs Most graphs in economics are based on a grid bordered on the left and below by two perpendicular lines that show the values of two variables: x and y. One variable is called the x-variable and the other is called the y-variable. The solid horizontal line at the bottom of the graph is called the horizontal axis or x- axis, and values of the x-variable are measured along it. Similarly, the solid vertical line on the left of the graph is called the vertical axis or y-axis, and values of the y-variable are measured along it. The point where the two axes meet, each variable is equal to zero. This is known as the origin. As you move rightward from the origin along the x-axis, values of the x-variable are positive and increasing. As you move up from the origin along the y-axis, values of the y-variable are positive and increasing. The table below shows the data on the outside temperature and the number of ice cream cones that a typical vendor can expect to sell at a football stadium during one game. Point Y-Variable: Number of Ice Cream X-Variable: Temperature Outside Cones Sold 40 0 60 10 70 30 A B с 80 50 D 90 70 E The first column shows the values of outside temperature (the x-variable) and the second column shows the number of ice cream cones sold (the y-variable). Five combinations or pairs of the two variables are shown, each denoted by A through E in the third column.
You can plot each of the five points A through E on the graph by using a pair of numbers: the values that the x-variable and the y-variable take on for a given point. For example, at point A, the x-variable takes on the value of 40 and the y-variable takes on the value of 0. On the axis below, plot point A (40,0) and accordingly point B (60, 10), point C (70, 30), point D (80,50), point E (90,70). As you will see, if one of the variables for a point has a value of zero, it will lie on one of the axes. If the value of x is zero, the point will lie on the vertical axis (this is known as the vertical intercept); if the value of y is zero, the point will lie on the horizontal axis, like point A (known as the horizontal intercept). Line 90 80 70 - 60 - 50 Number of Ice Cream Cones Sold 40 30 - 20 - 10 0 30 40 50 60 70 80 90 100 Temperature Outside