- Demand For Sugar 3 00 A E Q 2 75 2 50 The Following Table Shows Hypothetical Demand Schedules For Sugar For Three Sepa 1 (34.62 KiB) Viewed 108 times
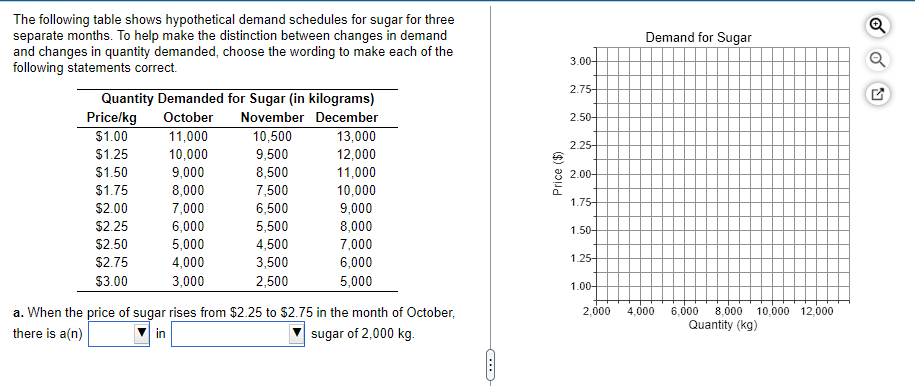
Demand for Sugar 3.00- a E Q 2.75 2.50- The following table shows hypothetical demand schedules for sugar for three separate months. To help make the distinction between changes in demand and changes in quantity demanded, choose the wording to make each of the following statements correct. Quantity Demanded for Sugar (in kilograms) Price/kg October November December $1.00 11,000 10,500 13,000 $1.25 10,000 9,500 12,000 $1.50 9,000 8,500 11,000 $1.75 8,000 7,500 10,000 $2.00 7,000 6,500 9,000 $2.25 6,000 5,500 8,000 $2.50 5,000 4,500 7,000 $2.75 4,000 3,500 6,000 $3.00 3,000 2,500 5,000 2.25- ($) Price 2.00- 1.75- 1.50 1.25- 1.00- 2.000 4.000 a. When the price of sugar rises from $2.25 to $2.75 in the month of October, there is an) in sugar of 2,000 kg. 6.000 8.000 10,000 12.000 Quantity (kg) C.