Page 1 of 1
Figure 1 shows the 'Great Gatsby Curve for a number of countries in (2019): Figure 1 - Gatsby Curve 0.45 United States 0
Posted: Thu May 19, 2022 7:54 am
by answerhappygod
- Figure 1 Shows The Great Gatsby Curve For A Number Of Countries In 2019 Figure 1 Gatsby Curve 0 45 United States 0 1 (50.09 KiB) Viewed 112 times
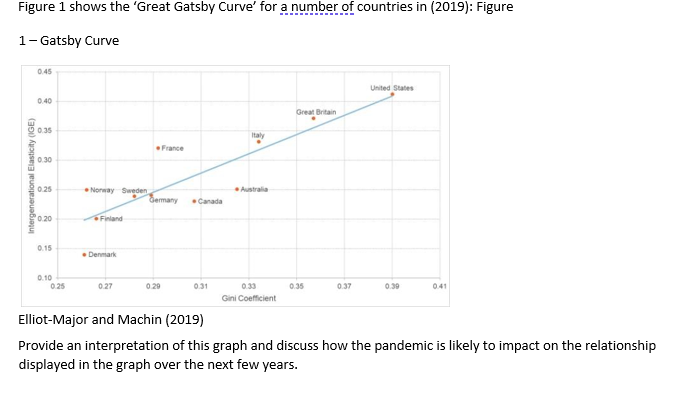
Figure 1 shows the 'Great Gatsby Curve for a number of countries in (2019): Figure 1 - Gatsby Curve 0.45 United States 0.40 Great Britain 0.35 Italy France 0.30 Intergenerational Elasticity (IGE) 0.25 . Australia NorwaySweden Germany Canada 0.20 Finland 0.15 • Dermark 0.10 0.25 0.27 0.29 0.31 0.35 0.37 0.30 0.41 0.33 Gini Coefficient Elliot-Major and Machin (2019) Provide an interpretation of this graph and discuss how the pandemic is likely to impact on the relationship displayed in the graph over the next few years.