Page 1 of 1
The following information is available for MVF Company (dollar amounts are in millions): 2016 2015 2013 2014 $19.6 $23.2
Posted: Tue Nov 16, 2021 9:25 am
by answerhappygod
- The Following Information Is Available For Mvf Company Dollar Amounts Are In Millions 2016 2015 2013 2014 19 6 23 2 1 (132.5 KiB) Viewed 116 times
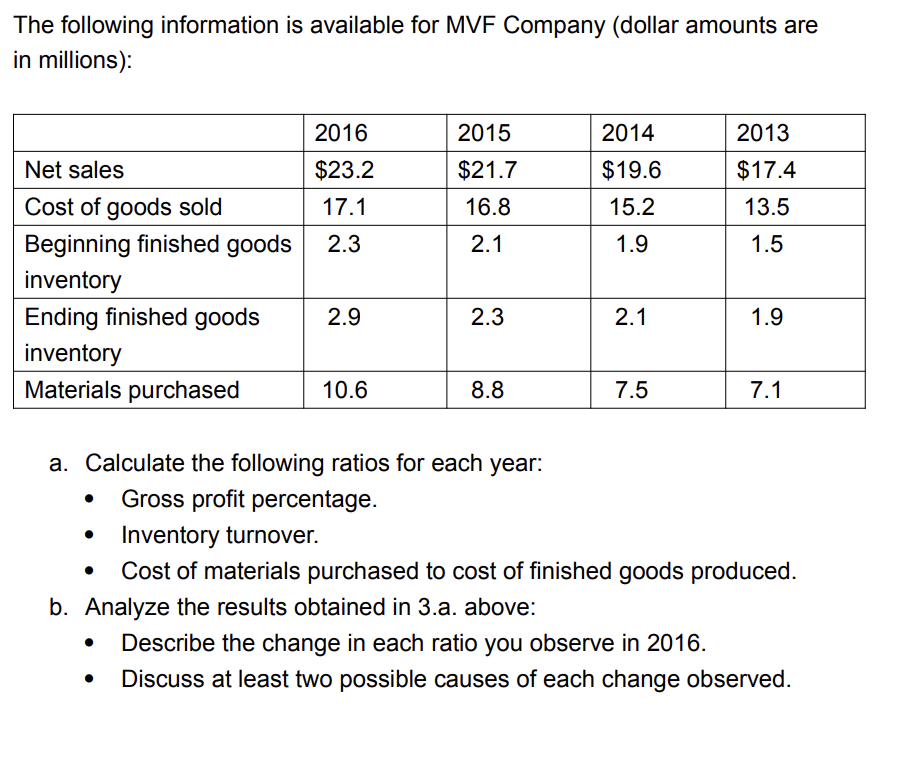
The following information is available for MVF Company (dollar amounts are in millions): 2016 2015 2013 2014 $19.6 $23.2 $21.7 16.8 $17.4 13.5 17.1 15.2 2.3 2.1 1.9 1.5 Net sales Cost of goods sold Beginning finished goods inventory Ending finished goods inventory Materials purchased 2.9 2.3 2.1 1.9 10.6 8.8 7.5 7.1 . . a. Calculate the following ratios for each year: Gross profit percentage. Inventory turnover. Cost of materials purchased to cost of finished goods produced. b. Analyze the results obtained in 3.a. above: Describe the change in each ratio you observe in 2016. Discuss at least two possible causes of each change observed. .