Page 1 of 1
If the call option's exercise price is $120. The current stock price is $100. When the market is good, the stock's price
Posted: Wed May 18, 2022 10:23 pm
by answerhappygod
- If The Call Option S Exercise Price Is 120 The Current Stock Price Is 100 When The Market Is Good The Stock S Price 1 (366.87 KiB) Viewed 70 times
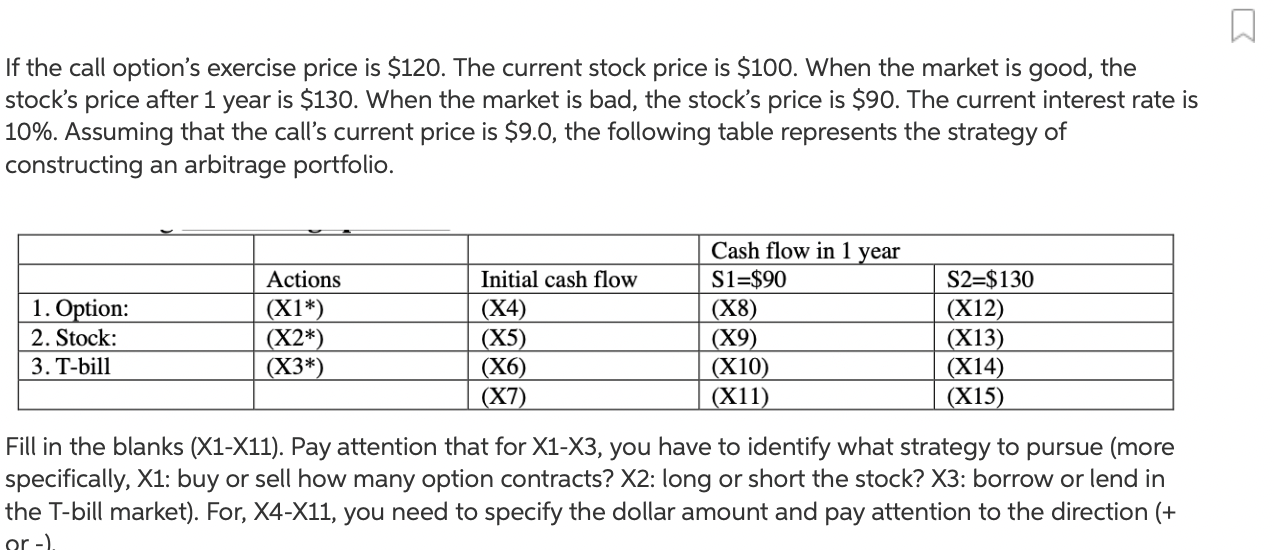
If the call option's exercise price is $120. The current stock price is $100. When the market is good, the stock's price after 1 year is $130. When the market is bad, the stock's price is $90. The current interest rate is 10%. Assuming that the call's current price is $9.0, the following table represents the strategy of constructing an arbitrage portfolio. 1. Option: 2. Stock: 3. T-bill Actions (X1*) (X2*) (X3*) Initial cash flow (X4) (X5) (X6) (X7) Cash flow in 1 year S1=$90 (X8) (X9) (X10) (X11) S2=$130 (X12) (X13) (X14) (X15) Fill in the blanks (X1-X11). Pay attention that for X1-X3, you have to identify what strategy to pursue (more specifically, X1: buy or sell how many option contracts? X2: long or short the stock? X3: borrow or lend in the T-bill market). For, X4-X11, you need to specify the dollar amount and pay attention to the direction (+ or -).