Page 1 of 1
Regression Statistics Multiple R R Square Adjusted R Square Standard Error Observations 0.53003249 Х 0.66289897 0.061576
Posted: Wed May 18, 2022 10:20 pm
by answerhappygod
- 1 (109.53 KiB) Viewed 67 times
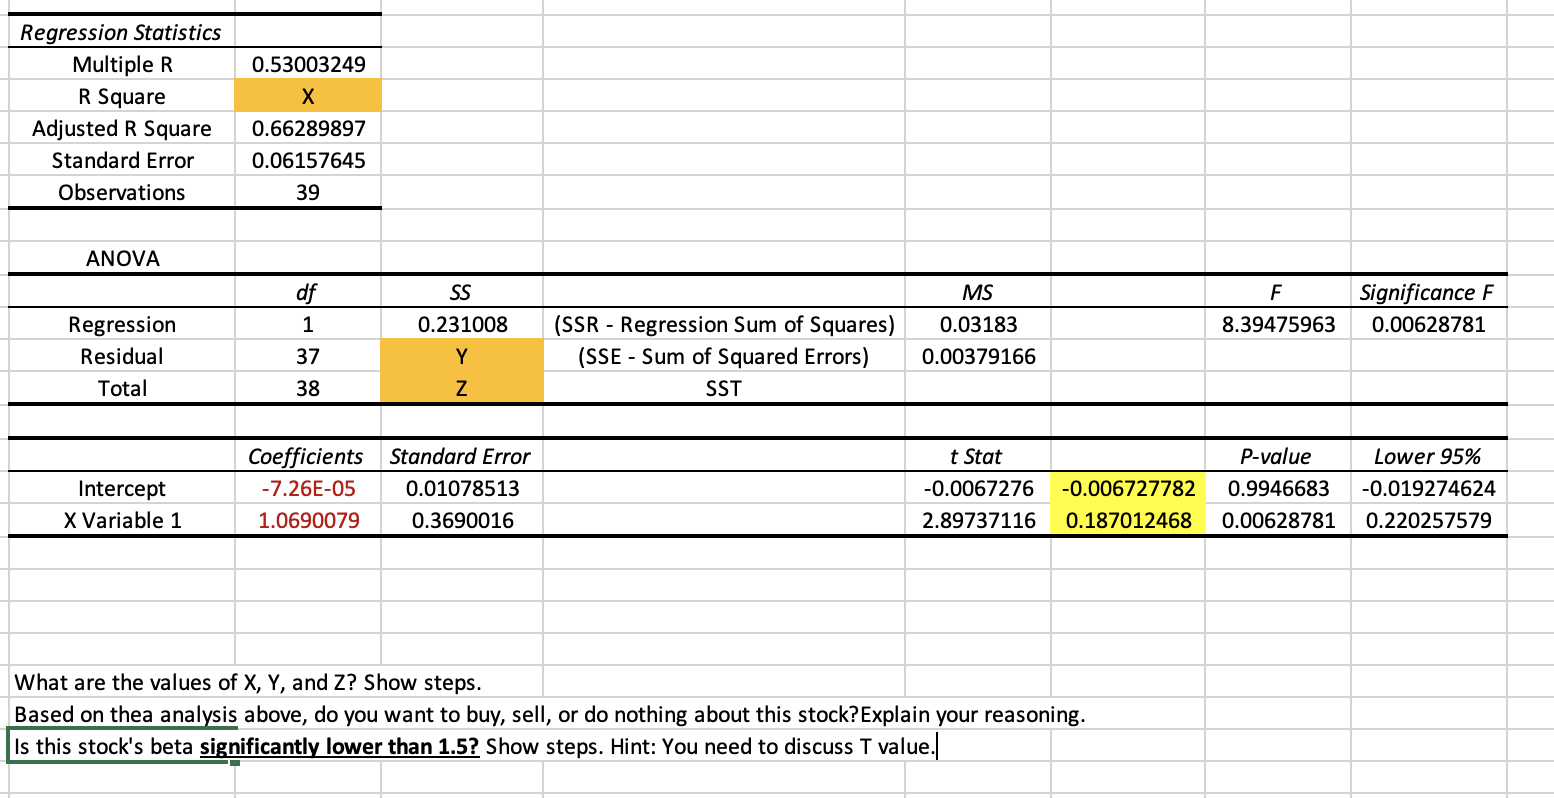
Regression Statistics Multiple R R Square Adjusted R Square Standard Error Observations 0.53003249 Х 0.66289897 0.06157645 39 ANOVA df SS MS F Significance F 0.00628781 1 0.231008 8.39475963 Regression Residual Total 0.03183 0.00379166 37 (SSR - Regression Sum of Squares) (SSE - Sum of Squared Errors) SST Y 38 Z Intercept X Variable 1 Coefficients Standard Error -7.26E-05 0.01078513 1.0690079 0.3690016 t Stat -0.0067276 2.89737116 -0.006727782 0.187012468 P-value 0.9946683 0.00628781 Lower 95% -0.019274624 0.220257579 What are the values of X, Y, and Z? Show steps. Based on thea analysis above, do you want to buy, sell, or do nothing about this stock? Explain your reasoning. Is this stock's beta significantly lower than 1.5? Show steps. Hint: You need to discuss T value.