Page 1 of 1
Activity 2 Identify which types of graph is applicable in presenting the following sets of data. 1. Monthly Electric Con
Posted: Wed May 18, 2022 10:09 pm
by answerhappygod
- Activity 2 Identify Which Types Of Graph Is Applicable In Presenting The Following Sets Of Data 1 Monthly Electric Con 1 (141.75 KiB) Viewed 68 times
- Activity 2 Identify Which Types Of Graph Is Applicable In Presenting The Following Sets Of Data 1 Monthly Electric Con 2 (81.2 KiB) Viewed 68 times
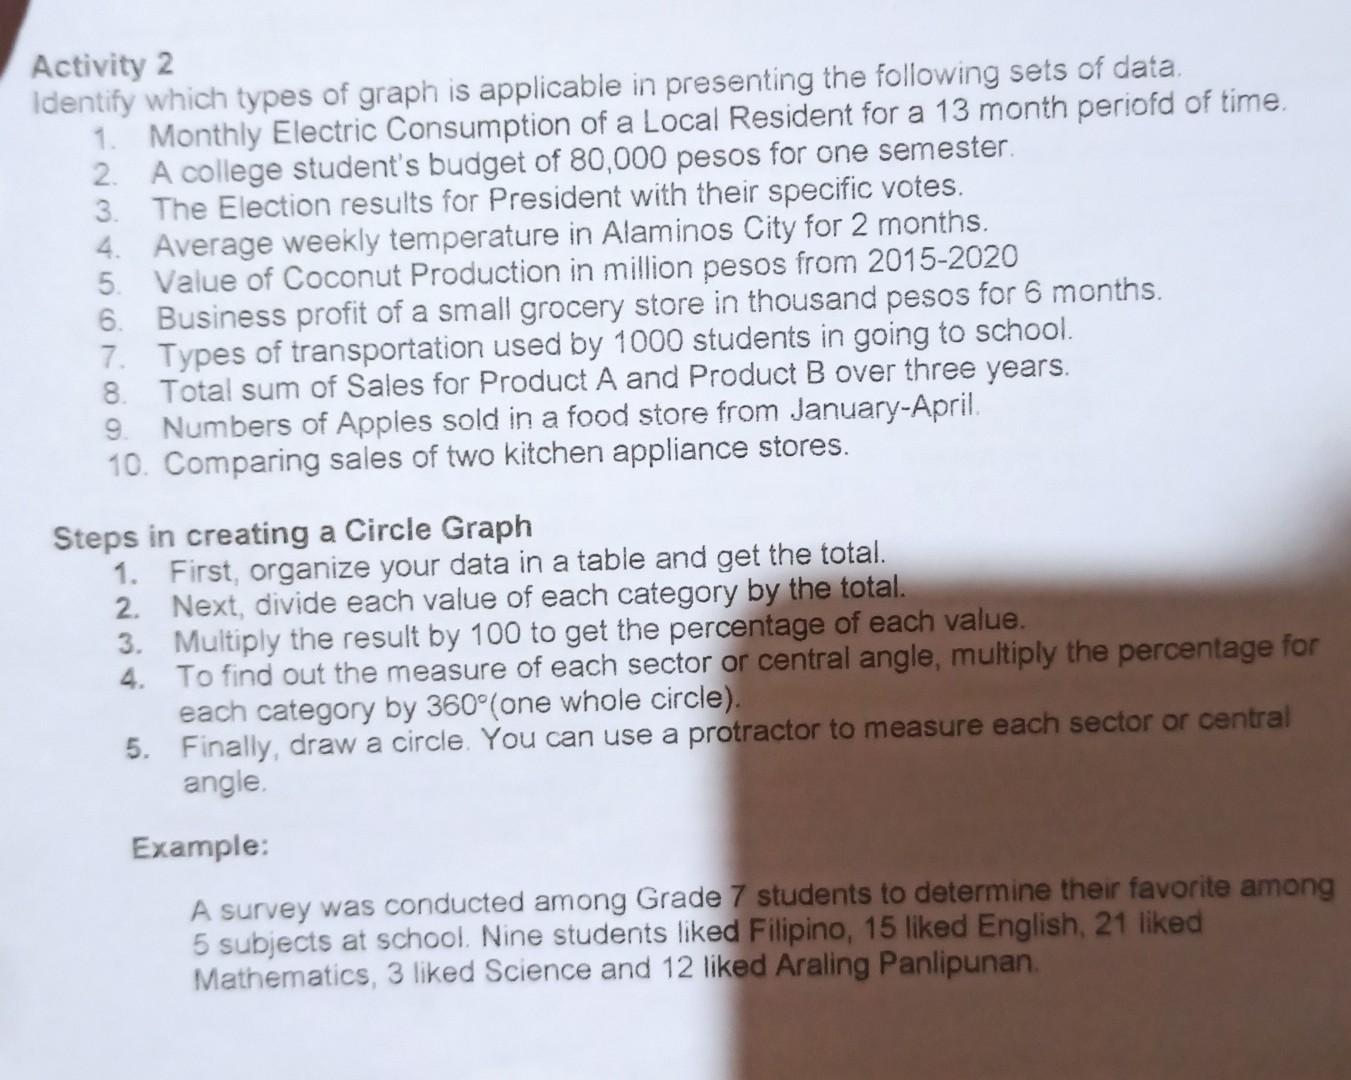
Activity 2 Identify which types of graph is applicable in presenting the following sets of data. 1. Monthly Electric Consumption of a Local Resident for a 13 month periofd of time. 2. A college student's budget of 80,000 pesos for one semester. 3. The Election results for President with their specific votes. 4. Average weekly temperature in Alaminos City for 2 months. 5. Value of Coconut Production in million pesos from 2015-2020 6. Business profit of a small grocery store in thousand pesos for 6 months. 7 Types of transportation used by 1000 students in going to school. 8. Total sum of Sales for Product A and Product B over three years. 9. Numbers of Apples sold in a food store from January-April 10. Comparing sales of two kitchen appliance stores. Steps in creating a Circle Graph 1. First, organize your data in a table and get the total. 2. Next, divide each value of each category by the total. 3. Multiply the result by 100 to get the percentage of each value. 4. To find out the measure of each sector or central angle, multiply the percentage for each category by 360°(one whole circle). 5. Finally, draw a circle. You can use a protractor to measure each sector or central angle. Example: A survey was conducted among Grade 7 students to determine their favorite among 5 subjects at school. Nine students liked Filipino, 15 liked English, 21 liked Mathematics, 3 liked Science and 12 liked Araling Panlipunan
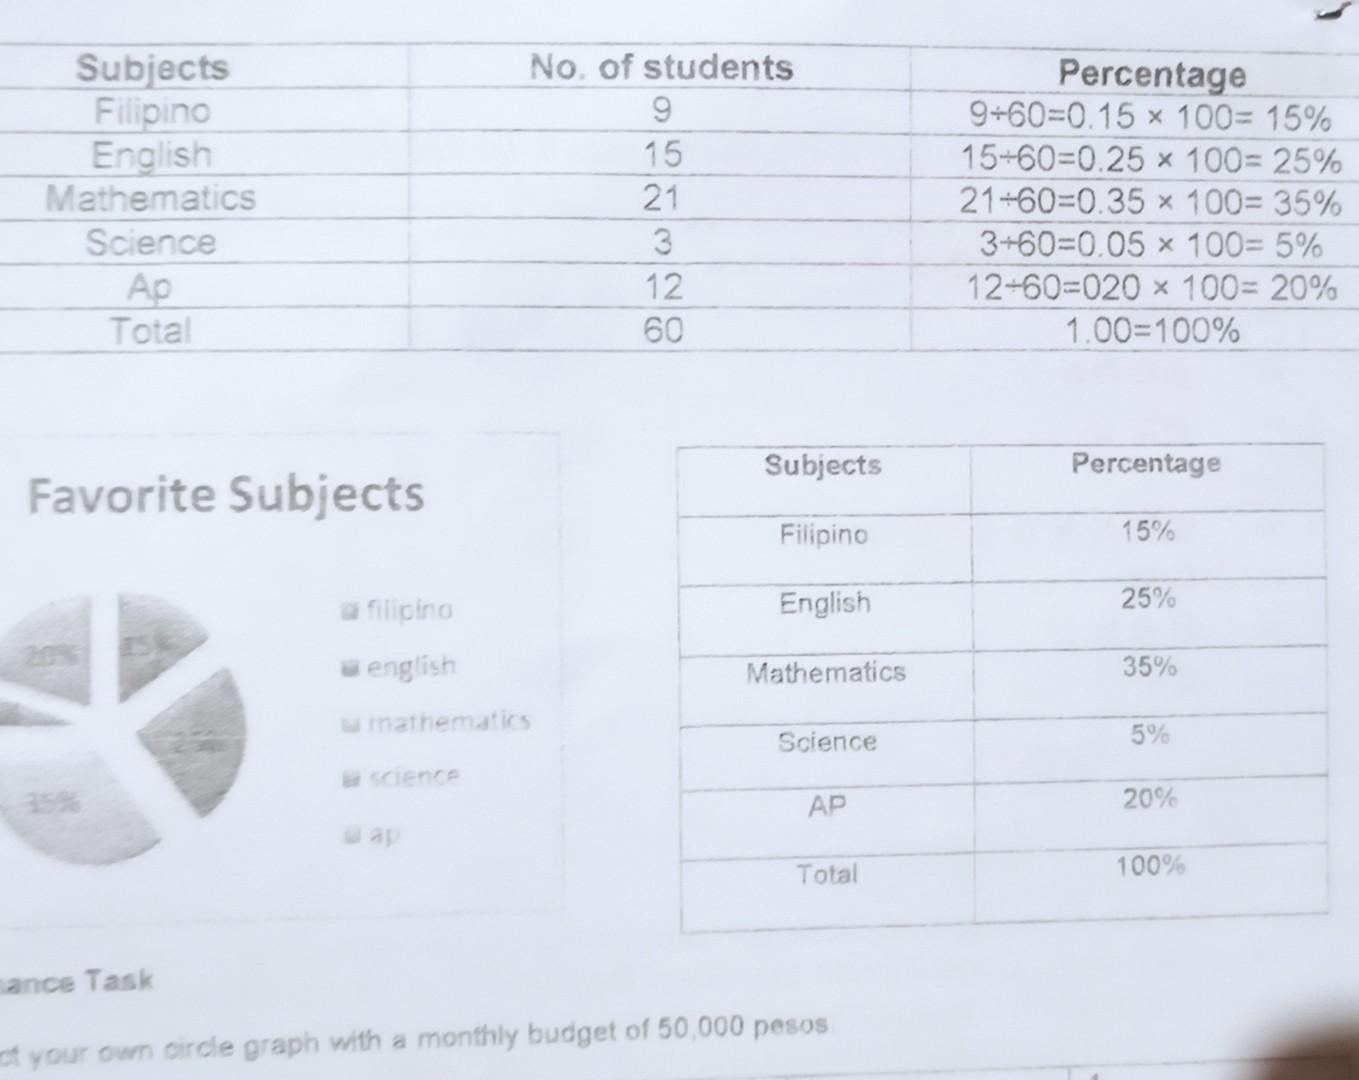
Subjects Filipino English Mathematics Science Ap Total No. of students 9 15 21 3 12 60 Percentage 9+60=0.15 x 100= 15% 15-60=0.25 x 100= 25% 21-60=0.35 x 100= 35% 3+60=0.05 x 100= 5% 12-60=020 x 100= 20% 1.00=100% Subjects Percentage Favorite Subjects Filipino 15% filipino English 25% english Mathematics 35% mathematics Science 5% AP 20% Total 100% ance Task ct your own circle graph with a monthly budget of 50,000 pesos