Page 1 of 1
C. Hjulstrom Diagram. The following statements refer to the Hjulstrom Diagram below. Place a Tin the blank of each true
Posted: Wed May 18, 2022 4:07 pm
by answerhappygod
- C Hjulstrom Diagram The Following Statements Refer To The Hjulstrom Diagram Below Place A Tin The Blank Of Each True 1 (60.61 KiB) Viewed 37 times
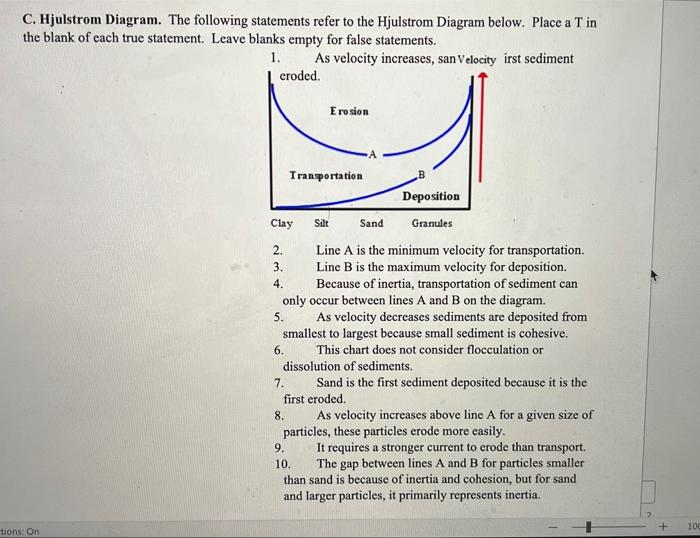
C. Hjulstrom Diagram. The following statements refer to the Hjulstrom Diagram below. Place a Tin the blank of each true statement. Leave blanks empty for false statements. 1. As velocity increases, san Velocity irst sediment eroded. Erosion Transportation B Deposition Clay Silt Sand Granules . 2. Line A is the minimum velocity for transportation. 3. Line B is the maximum velocity for deposition. 4. Because of inertia, transportation of sediment can only occur between lines A and B on the diagram. 5. As velocity decreases sediments are deposited from smallest to largest because small sediment is cohesive. 6. This chart does not consider flocculation or dissolution of sediments. 7. Sand is the first sediment deposited because it is the first eroded. 8. As velocity increases above line A for a given size of particles, these particles erode more easily. 9 It requires a stronger current to erode than transport. 10. The gap between lines A and B for particles smaller than sand is because of inertia and cohesion, but for sand and larger particles, it primarily represents inertia. + 100 tions: On