Page 1 of 1
Question 2 - Genetics (10 points total) - OD 2 Chart A Chart B Question 2 - 2 points 2A (2 pts). Which pedigree chart is
Posted: Wed May 18, 2022 2:59 pm
by answerhappygod
- Question 2 Genetics 10 Points Total Od 2 Chart A Chart B Question 2 2 Points 2a 2 Pts Which Pedigree Chart Is 1 (77.22 KiB) Viewed 56 times
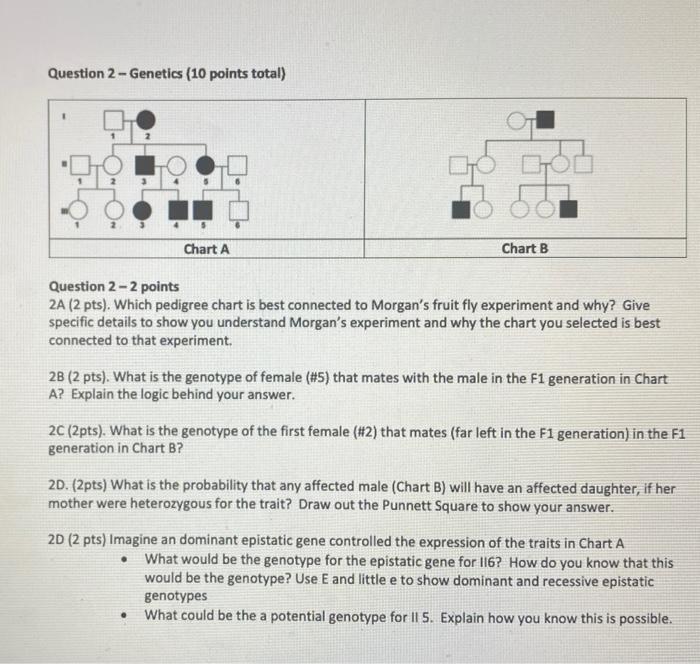
Question 2 - Genetics (10 points total) - OD 2 Chart A Chart B Question 2 - 2 points 2A (2 pts). Which pedigree chart is best connected to Morgan's fruit fly experiment and why? Give specific details to show you understand Morgan's experiment and why the chart you selected is best connected to that experiment. 2B (2 pts). What is the genotype of female (#5) that mates with the male in the F1 generation in Chart A? Explain the logic behind your answer. 2C (2pts). What is the genotype of the first female (#2) that mates (far left in the F1 generation) in the F1 generation in Chart B? 2D. (2pts) What is the probability that any affected male (Chart B) will have an affected daughter, if her mother were heterozygous for the trait? Draw out the Punnett Square to show your answer. 2D (2 pts) Imagine an dominant epistatic gene controlled the expression of the traits in Chart A • What would be the genotype for the epistatic gene for 116? How do you know that this would be the genotype? Use E and little e to show dominant and recessive epistatic genotypes What could be the a potential genotype for 11 5. Explain how you know this is possible.