Page 1 of 1
6. In class we looked at some simple regression tables based on census and crime data for Irvine CA. Write out the linea
Posted: Sun Sep 05, 2021 5:02 pm
by answerhappygod
- 6 In Class We Looked At Some Simple Regression Tables Based On Census And Crime Data For Irvine Ca Write Out The Linea 1 (96.79 KiB) Viewed 546 times
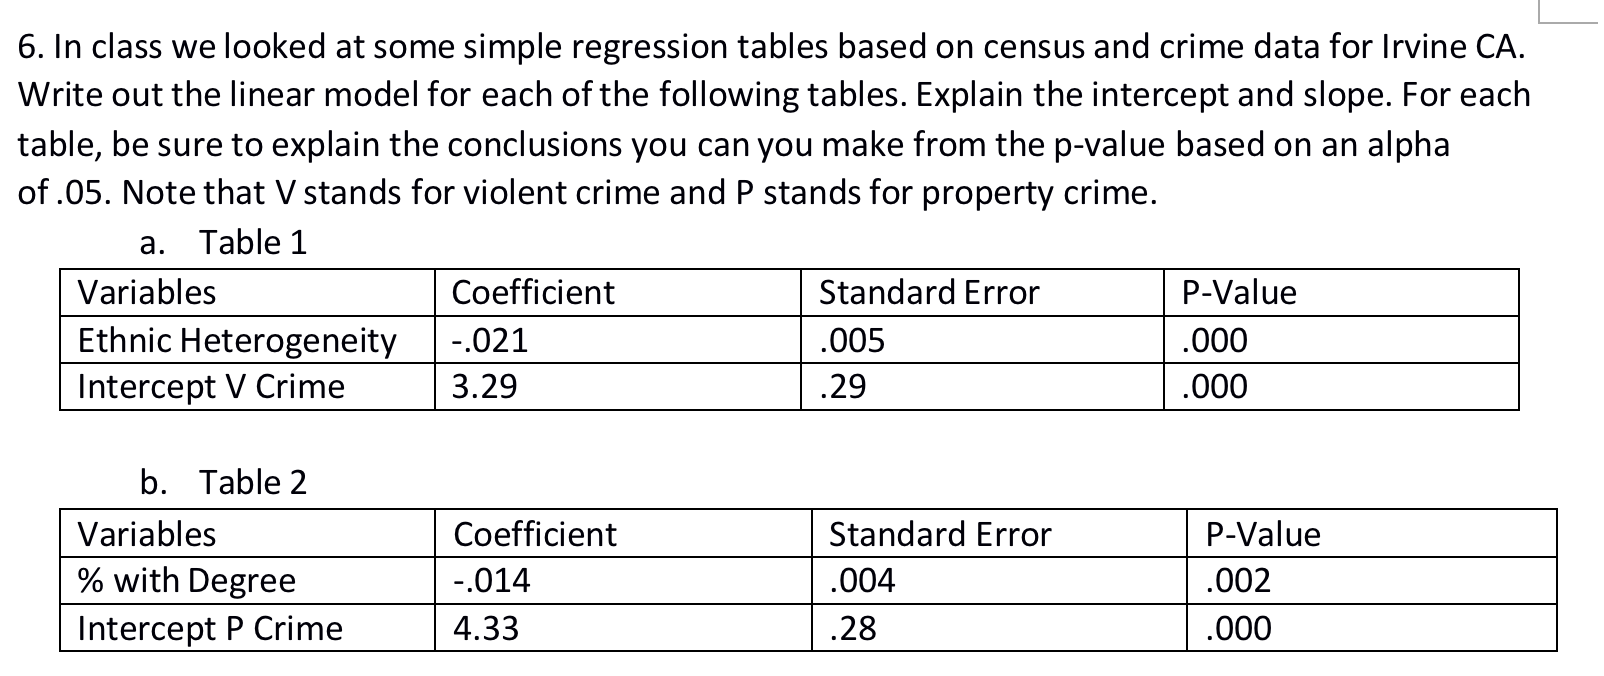
6. In class we looked at some simple regression tables based on census and crime data for Irvine CA. Write out the linear model for each of the following tables. Explain the intercept and slope. For each table, be sure to explain the conclusions you can you make from the p-value based on an alpha of .05. Note that V stands for violent crime and P stands for property crime. Table 1 Variables Coefficient Standard Error P-Value Ethnic Heterogeneity -.021 .005 .000 Intercept V Crime 3.29 .29 .000 a. b. Table 2 Variables % with Degree Intercept P Crime Coefficient -.014 4.33 Standard Error .004 .28 P-Value .002 .000