Page 1 of 1
You obtained the following raw data when setting up a Bradford standard curve: BSA (mg/ml) Absorbancy 595m 0 0.225 1 0.3
Posted: Wed May 18, 2022 11:11 am
by answerhappygod
- You Obtained The Following Raw Data When Setting Up A Bradford Standard Curve Bsa Mg Ml Absorbancy 595m 0 0 225 1 0 3 1 (15.85 KiB) Viewed 41 times
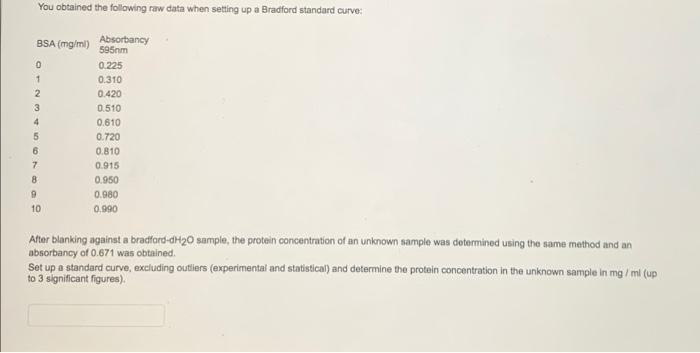
You obtained the following raw data when setting up a Bradford standard curve: BSA (mg/ml) Absorbancy 595m 0 0.225 1 0.310 2 0.420 3 0.510 4 0.610 5 0.720 6 0.810 7 0.915 8 0.950 9 0.980 10 0,990 After blanking against a bradford-dH20 sample, the protein concentration of an unknown sample was determined using the same method and an absorbancy of 0.671 was obtained Set up a standard curve, excluding outliers (experimental and statistical) and determine the protein concentration in the unknown sample in mg/ml (up to 3 significant figures)