Page 1 of 1
1.000 200°c 100°C N 0.999 0°C 0.998 0 0.02 0.04 0.06 0.08 0.10 P/bar Figure 1: Z vs. P for ammonia at low pressure and t
Posted: Wed May 18, 2022 10:19 am
by answerhappygod
- 1 000 200 C 100 C N 0 999 0 C 0 998 0 0 02 0 04 0 06 0 08 0 10 P Bar Figure 1 Z Vs P For Ammonia At Low Pressure And T 1 (51.35 KiB) Viewed 64 times
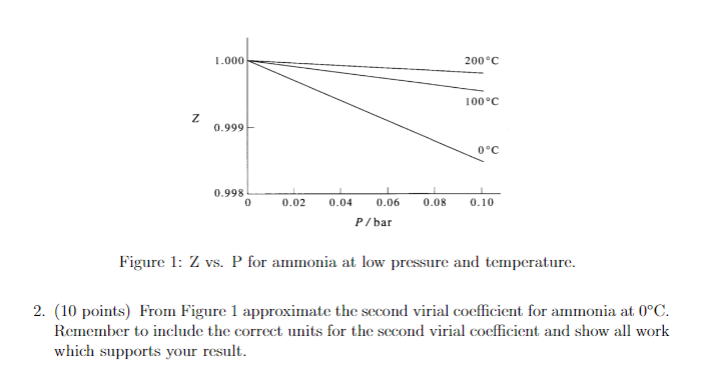
1.000 200°c 100°C N 0.999 0°C 0.998 0 0.02 0.04 0.06 0.08 0.10 P/bar Figure 1: Z vs. P for ammonia at low pressure and temperature. 2. (10 points) From Figure 1 approximate the second virial coefficient for ammonia at 0°C. Remember to include the correct units for the second virial coefficient and show all work which supports your result.